# Technical Document Extraction: Performance Heatmap Analysis
## 1. Component Isolation
* **Header:** None present.
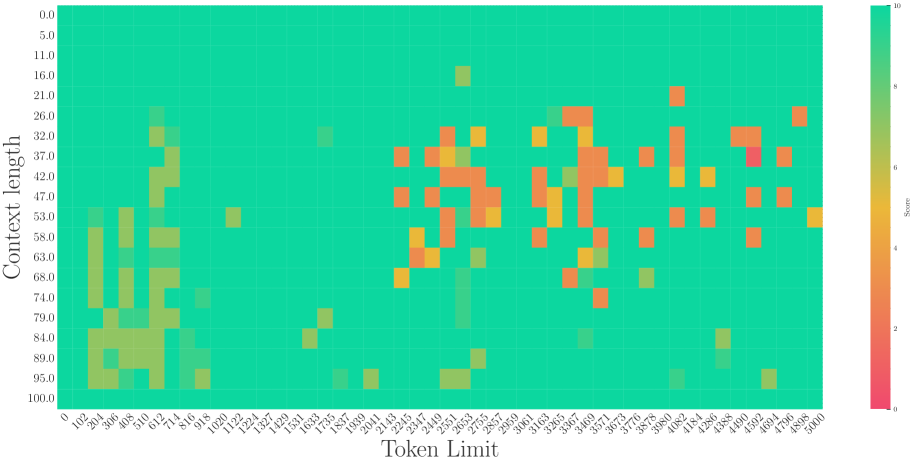
* **Main Chart Area:** A 2D heatmap representing "Score" across two variables: "Token Limit" (X-axis) and "Context length" (Y-axis).
* **Legend:** A vertical color bar located on the far right [x=right, y=center].
* **Axes:** Labeled X and Y axes with numerical markers.
---
## 2. Axis and Legend Extraction
### Y-Axis: Context length
* **Label:** Context length
* **Orientation:** Vertical (left side)
* **Scale:** 0.0 to 100.0
* **Markers:** 0.0, 5.0, 11.0, 16.0, 21.0, 26.0, 32.0, 37.0, 42.0, 47.0, 53.0, 58.0, 63.0, 68.0, 74.0, 79.0, 84.0, 89.0, 95.0, 100.0.
### X-Axis: Token Limit
* **Label:** Token Limit
* **Orientation:** Horizontal (bottom)
* **Scale:** 0 to 5000
* **Markers:** 0, 102, 204, 306, 408, 510, 612, 714, 816, 918, 1020, 1122, 1224, 1327, 1429, 1531, 1633, 1735, 1837, 1939, 2041, 2143, 2245, 2347, 2449, 2551, 2653, 2755, 2857, 2959, 3061, 3163, 3265, 3367, 3469, 3571, 3673, 3776, 3878, 3980, 4082, 4184, 4286, 4388, 4490, 4592, 4694, 4796, 4898, 5000.
### Legend: Score
* **Label:** Score
* **Type:** Continuous Gradient
* **Range:** 0 to 10
* **Color Mapping:**
* **10 (High):** Bright Teal/Green
* **5-7 (Medium):** Yellow/Orange
* **0 (Low):** Red/Pink
---
## 3. Trend Verification and Data Analysis
### Visual Trend Description
The heatmap is predominantly teal (Score 10), indicating high performance across most configurations. However, there are distinct "clusters of degradation" where the score drops into the 2–7 range (orange/yellow/red).
1. **Early Token Limit Cluster:** Between Token Limits 102 and 918, there is a vertical band of degradation across Context lengths 32.0 to 95.0.
2. **Mid-to-High Token Limit Cluster:** Between Token Limits 2143 and 4898, there is a scattered "cloud" of degradation, primarily concentrated between Context lengths 21.0 and 74.0.
3. **Stability Zone:** The top of the chart (Context length 0.0 to 16.0) and the far left (Token Limit 0) remain almost entirely teal (Score 10), regardless of other parameters.
### Key Data Points (Degradation Samples)
Based on the color-to-legend cross-referencing:
| Token Limit (X) | Context Length (Y) | Estimated Score | Color Note |
| :--- | :--- | :--- | :--- |
| 4490 | 37.0 | ~1-2 | Deep Pink/Red (Lowest observed) |
| 2551 | 37.0 | ~4-5 | Orange/Yellow |
| 612 | 32.0 | ~6-7 | Yellow-Green |
| 2653 | 16.0 | ~7 | Light Green/Yellow |
| 3469 | 74.0 | ~4 | Orange |
| 4898 | 26.0 | ~4 | Orange |
---
## 4. Summary of Information
This chart visualizes the performance (Score) of a system relative to its Token Limit and Context Length.
* **Optimal Performance:** Achieved at low Context lengths (<16.0) and very low Token Limits (<102).
* **Systemic Weakness:** The system shows significant performance drops (scores as low as 1-2) when the Token Limit is high (approx. 4500) and Context length is moderate (approx. 37.0).
* **Inconsistency:** There is a high degree of variance in the 2000-5000 Token Limit range, where scores fluctuate rapidly between 10 and 4 within small changes of Context length.