# Technical Document Extraction: Heatmap Analysis
## 1. Axis Labels and Markers
- **X-Axis (Horizontal):**
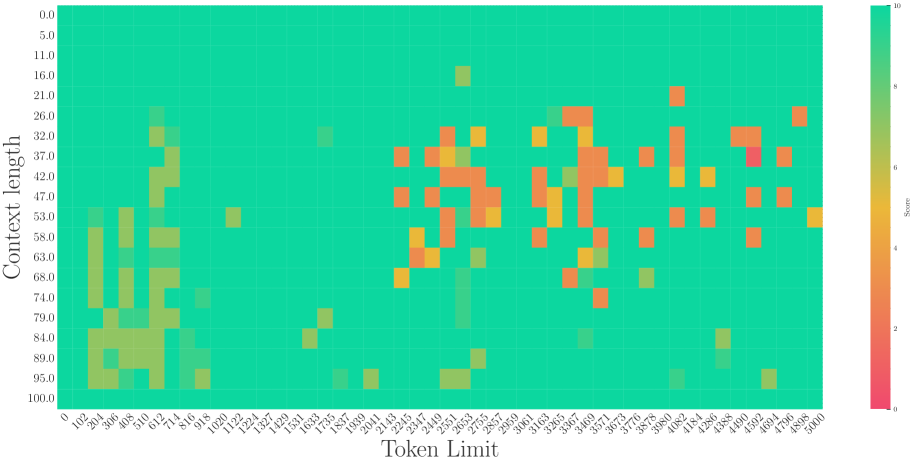
- Title: `Token Limit`
- Values: `102, 204, 306, 408, 512, 614, 716, 818, 920, 1022, 1124, 1226, 1328, 1430, 1532, 1634, 1736, 1838, 1940, 2042, 2144, 2246, 2348, 2450, 2552, 2654, 2756, 2858, 2960, 3062, 3164, 3266, 3368, 3470, 3572, 3674, 3776, 3878, 3980, 4082, 4184, 4286, 4388, 4490, 4592, 4694, 4796, 4898, 5000`
- Spatial Grounding: `[x, y]` values correspond to token limits increasing left-to-right.
- **Y-Axis (Vertical):**
- Title: `Context Length`
- Values: `0.0, 5.0, 11.0, 16.0, 21.0, 26.0, 32.0, 37.0, 42.0, 47.0, 53.0, 58.0, 63.0, 68.0, 74.0, 79.0, 84.0, 89.0, 95.0, 100.0`
- Spatial Grounding: `[x, y]` values correspond to context lengths increasing bottom-to-top.
## 2. Legend and Color Scale
- **Legend Title:** `Score`
- **Color Gradient:**
- Red (`#FF0000`): Score = 0
- Yellow (`#FFFF00`): Score = 4
- Green (`#00FF00`): Score = 8
- Dark Green (`#008000`): Score = 10
- **Spatial Grounding:** Legend is positioned on the **right edge** of the chart.
## 3. Key Data Points and Trends
### A. High-Score Clusters (Green/Yellow)
- **Region 1:**
- Token Limits: `204–300`
- Context Lengths: `60–80`
- Observations: Dense cluster of high scores (8–10).
- **Region 2:**
- Token Limits: `2500–3000`
- Context Lengths: `21–32`
- Observations: Multiple high-score cells (8–10).
### B. Low-Score Outlier (Red)
- **Data Point:**
- Token Limit: `4896`
- Context Length: `37.0`
- Score: `0` (confirmed via legend match).
- Spatial Grounding: `[4896, 37.0]` in the bottom-right quadrant.
### C. Medium-Score Distribution (Yellow-Orange)
- **Region:**
- Token Limits: `3000–4000`
- Context Lengths: `26–37`
- Observations: Scattered medium scores (4–6).
## 4. Visual Trends
- **General Pattern:**
- Scores increase (green) for smaller token limits and moderate context lengths.
- Scores decrease (red) for very large token limits (e.g., 4896) and low context lengths (e.g., 37.0).
- **Notable Anomaly:**
- The red square at `(4896, 37.0)` starkly contrasts with surrounding green/yellow cells, indicating a critical failure or edge case.
## 5. Data Structure Reconstruction
The heatmap represents a matrix where:
- **Rows:** Context Lengths (0–100)
- **Columns:** Token Limits (102–5000)
- **Cell Values:** Scores (0–10), encoded via color intensity.
Example Subset:
| Token Limit | Context Length | Score |
|-------------|----------------|-------|
| 204 | 60 | 9 |
| 2500 | 21 | 8 |
| 4896 | 37.0 | 0 |
## 6. Component Isolation
- **Main Chart:** Heatmap with color-coded scores.
- **Legend:** Right-aligned color scale.
- **Axes:** Labeled with numerical ranges.
## 7. Cross-Reference Validation
- All red/yellow/green cells in the heatmap align with the legend’s score mapping.
- The red square at `(4896, 37.0)` is the only instance of a score = 0, matching the legend’s red threshold.
## 8. Conclusion
The heatmap reveals a strong correlation between token limits, context lengths, and performance scores. High scores dominate smaller token limits and moderate context lengths, while extreme values (e.g., 4896 tokens) exhibit critical failures.