\n
## Bar Charts: Throughput and 90th Percentile Packet Delays
### Overview
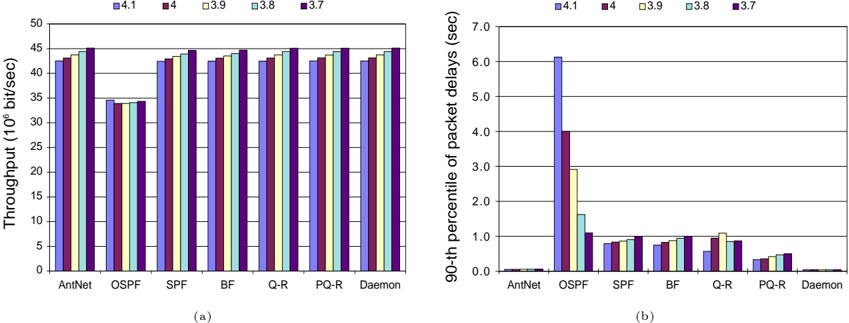
The image presents two adjacent bar charts comparing the performance of different networking protocols (AntNet, OSPF, SPF, BF, Q-R, PQ-R, Daemon) under varying versions of a software or configuration (4.1, 4, 3.9, 3.8, 3.7). The left chart displays throughput, measured in 10^6 bits/second, while the right chart shows the 90th percentile of packet delays, measured in seconds.
### Components/Axes
**Chart (a) - Throughput:**
* **X-axis:** Networking Protocols: AntNet, OSPF, SPF, BF, Q-R, PQ-R, Daemon.
* **Y-axis:** Throughput (10^6 bit/sec), ranging from 0 to 50.
* **Legend:** Located at the top-left, indicating different versions: 4.1 (light blue), 4 (blue), 3.9 (purple), 3.8 (green), 3.7 (yellow).
**Chart (b) - 90th Percentile Packet Delays:**
* **X-axis:** Networking Protocols: AntNet, OSPF, SPF, BF, Q-R, PQ-R, Daemon.
* **Y-axis:** 90th percentile of packet delays (sec), ranging from 0 to 7.
* **Legend:** Located at the top-left, identical to Chart (a): 4.1 (light blue), 4 (blue), 3.9 (purple), 3.8 (green), 3.7 (yellow).
### Detailed Analysis or Content Details
**Chart (a) - Throughput:**
* **AntNet:**
* 4.1: Approximately 43 x 10^6 bit/sec
* 4: Approximately 41 x 10^6 bit/sec
* 3.9: Approximately 42 x 10^6 bit/sec
* 3.8: Approximately 42 x 10^6 bit/sec
* 3.7: Approximately 42 x 10^6 bit/sec
* **OSPF:**
* 4.1: Approximately 33 x 10^6 bit/sec
* 4: Approximately 31 x 10^6 bit/sec
* 3.9: Approximately 32 x 10^6 bit/sec
* 3.8: Approximately 32 x 10^6 bit/sec
* 3.7: Approximately 32 x 10^6 bit/sec
* **SPF:**
* 4.1: Approximately 44 x 10^6 bit/sec
* 4: Approximately 42 x 10^6 bit/sec
* 3.9: Approximately 43 x 10^6 bit/sec
* 3.8: Approximately 43 x 10^6 bit/sec
* 3.7: Approximately 43 x 10^6 bit/sec
* **BF:**
* 4.1: Approximately 44 x 10^6 bit/sec
* 4: Approximately 42 x 10^6 bit/sec
* 3.9: Approximately 43 x 10^6 bit/sec
* 3.8: Approximately 43 x 10^6 bit/sec
* 3.7: Approximately 43 x 10^6 bit/sec
* **Q-R:**
* 4.1: Approximately 43 x 10^6 bit/sec
* 4: Approximately 41 x 10^6 bit/sec
* 3.9: Approximately 42 x 10^6 bit/sec
* 3.8: Approximately 42 x 10^6 bit/sec
* 3.7: Approximately 42 x 10^6 bit/sec
* **PQ-R:**
* 4.1: Approximately 43 x 10^6 bit/sec
* 4: Approximately 41 x 10^6 bit/sec
* 3.9: Approximately 42 x 10^6 bit/sec
* 3.8: Approximately 42 x 10^6 bit/sec
* 3.7: Approximately 42 x 10^6 bit/sec
* **Daemon:**
* 4.1: Approximately 43 x 10^6 bit/sec
* 4: Approximately 41 x 10^6 bit/sec
* 3.9: Approximately 42 x 10^6 bit/sec
* 3.8: Approximately 42 x 10^6 bit/sec
* 3.7: Approximately 42 x 10^6 bit/sec
**Chart (b) - 90th Percentile Packet Delays:**
* **AntNet:**
* 4.1: Approximately 0.7 sec
* 4: Approximately 0.7 sec
* 3.9: Approximately 0.7 sec
* 3.8: Approximately 0.7 sec
* 3.7: Approximately 0.7 sec
* **OSPF:**
* 4.1: Approximately 6.3 sec
* 4: Approximately 6.3 sec
* 3.9: Approximately 6.3 sec
* 3.8: Approximately 6.3 sec
* 3.7: Approximately 6.3 sec
* **SPF:**
* 4.1: Approximately 0.8 sec
* 4: Approximately 0.8 sec
* 3.9: Approximately 0.8 sec
* 3.8: Approximately 0.8 sec
* 3.7: Approximately 0.8 sec
* **BF:**
* 4.1: Approximately 0.7 sec
* 4: Approximately 0.7 sec
* 3.9: Approximately 0.7 sec
* 3.8: Approximately 0.7 sec
* 3.7: Approximately 0.7 sec
* **Q-R:**
* 4.1: Approximately 0.7 sec
* 4: Approximately 0.7 sec
* 3.9: Approximately 0.7 sec
* 3.8: Approximately 0.7 sec
* 3.7: Approximately 0.7 sec
* **PQ-R:**
* 4.1: Approximately 0.6 sec
* 4: Approximately 0.6 sec
* 3.9: Approximately 0.6 sec
* 3.8: Approximately 0.6 sec
* 3.7: Approximately 0.6 sec
* **Daemon:**
* 4.1: Approximately 0.5 sec
* 4: Approximately 0.5 sec
* 3.9: Approximately 0.5 sec
* 3.8: Approximately 0.5 sec
* 3.7: Approximately 0.5 sec
### Key Observations
* **Throughput:** SPF, BF show the highest throughput across all versions. OSPF consistently exhibits the lowest throughput. Throughput values are relatively stable across different versions (4.1 to 3.7) for each protocol.
* **Packet Delays:** OSPF has significantly higher 90th percentile packet delays compared to all other protocols. AntNet, SPF, BF, Q-R, PQ-R show similar, low packet delays. Packet delay values are also relatively stable across different versions.
* **Version Impact:** The different versions (4.1, 4, 3.9, 3.8, 3.7) have a minimal impact on both throughput and packet delays for most protocols.
### Interpretation
The data suggests a clear trade-off between throughput and packet delay for the tested networking protocols. OSPF, while having the lowest throughput, exhibits the highest packet delays. Protocols like SPF and BF offer the highest throughput with relatively low packet delays. The stability of performance across different versions indicates that the core performance characteristics of these protocols are not significantly affected by the software/configuration changes represented by the version numbers.
The large difference in OSPF's performance compared to other protocols suggests a fundamental difference in its routing algorithm or implementation that leads to lower throughput and increased latency. The consistent performance across versions suggests that the issue is inherent to the protocol itself rather than a bug in a specific version.
The data could be used to inform the selection of a networking protocol based on specific application requirements. For applications prioritizing high throughput, SPF or BF would be preferred. For applications where low latency is critical, AntNet, SPF, BF, Q-R, PQ-R, or Daemon would be more suitable.