## Bar Charts: Throughput and Packet Delay Comparison of Network Protocols
### Overview
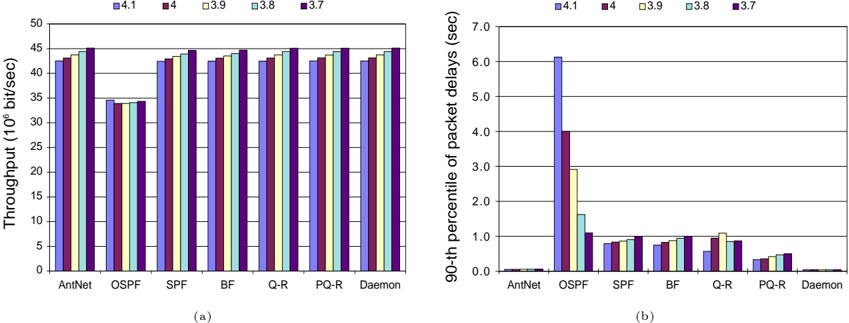
The image contains two side-by-side bar charts, labeled (a) and (b), comparing the performance of seven network protocols or methods across five different versions or parameter settings. Chart (a) measures throughput, while chart (b) measures the 90th percentile of packet delays.
### Components/Axes
**Chart (a) - Left Chart:**
* **Title/Label:** (a) at the bottom center.
* **Y-Axis:** Labeled "Throughput (10⁶ bits/sec)". Scale ranges from 0 to 50 in increments of 5.
* **X-Axis:** Lists seven categories: AntNet, OSPF, SPF, BF, Q-R, PQ-R, Daemon.
* **Legend:** Positioned at the top center of the chart area. Contains five colored squares with corresponding labels:
* Blue square: "4.1"
* Red square: "4"
* Yellow square: "3.9"
* Cyan square: "3.8"
* Purple square: "3.7"
**Chart (b) - Right Chart:**
* **Title/Label:** (b) at the bottom center.
* **Y-Axis:** Labeled "90-th percentile of packet delays (sec)". Scale ranges from 0.0 to 7.0 in increments of 1.0.
* **X-Axis:** Lists the same seven categories as chart (a): AntNet, OSPF, SPF, BF, Q-R, PQ-R, Daemon.
* **Legend:** Identical to chart (a), positioned at the top center.
### Detailed Analysis
**Chart (a) - Throughput Analysis:**
* **Trend Verification:** For most protocols (AntNet, SPF, BF, Q-R, PQ-R, Daemon), the throughput bars are relatively flat and high, showing minimal variation across the five versions (4.1 to 3.7). The OSPF protocol shows a distinctly lower throughput compared to the others.
* **Data Points (Approximate Values in 10⁶ bits/sec):**
* **AntNet:** All versions cluster between ~42 and ~45. Blue (4.1) ~43, Red (4) ~44, Yellow (3.9) ~44, Cyan (3.8) ~45, Purple (3.7) ~45.
* **OSPF:** All versions cluster between ~34 and ~35. Blue (4.1) ~35, Red (4) ~34, Yellow (3.9) ~34, Cyan (3.8) ~34, Purple (3.7) ~34.
* **SPF, BF, Q-R, PQ-R, Daemon:** All show very similar profiles to AntNet, with values consistently in the ~42 to ~45 range across all versions.
**Chart (b) - Packet Delay Analysis:**
* **Trend Verification:** The OSPF protocol shows a dramatic, descending stair-step pattern where delay decreases significantly as the version number decreases (from 4.1 to 3.7). All other protocols show consistently low delays with minor variations.
* **Data Points (Approximate Values in seconds):**
* **AntNet:** All versions are very low, near 0.0 to 0.1 sec.
* **OSPF:** Shows the most significant variation. Blue (4.1) ~6.1, Red (4) ~4.0, Yellow (3.9) ~3.0, Cyan (3.8) ~1.6, Purple (3.7) ~1.1.
* **SPF:** All versions are low, between ~0.8 and ~1.0.
* **BF:** All versions are low, between ~0.8 and ~1.0.
* **Q-R:** Shows a slight peak for Yellow (3.9) at ~1.1, others between ~0.6 and ~0.9.
* **PQ-R:** All versions are low, between ~0.3 and ~0.5.
* **Daemon:** All versions are extremely low, near 0.0 to 0.05 sec.
### Key Observations
1. **OSPF Performance Anomaly:** OSPF is a clear outlier in both metrics. It has the lowest throughput (Chart a) and, for versions 4.1 and 4, the highest packet delays by a large margin (Chart b).
2. **Version Sensitivity:** The performance of OSPF is highly sensitive to the version/parameter setting, especially for packet delay, which improves (decreases) by approximately 82% from version 4.1 to 3.7. Other protocols show minimal sensitivity.
3. **High-Performing Cluster:** AntNet, SPF, BF, Q-R, PQ-R, and Daemon form a high-performance cluster with high, stable throughput and low packet delays.
4. **Daemon's Delay:** The Daemon method achieves the lowest packet delays of all, near zero, across all versions.
### Interpretation
This data suggests a performance comparison of network routing or management algorithms. The "Daemon" and "AntNet" methods appear to be the most efficient, offering high throughput and minimal latency. The OSPF protocol, a standard link-state routing protocol, demonstrates a significant performance trade-off: its throughput is lower, and its latency can be very high under certain configurations (version 4.1). The strong version-dependency of OSPF's delay implies that its performance is highly tunable or sensitive to specific operational parameters. The charts effectively argue that the alternative methods (AntNet, Daemon, etc.) can outperform OSPF in both throughput and latency under the tested conditions. The near-identical performance of many protocols in chart (a) suggests the throughput metric may be less discriminating than the delay metric for this specific evaluation.