## Bar Charts: Network Protocol Performance Comparison
### Overview
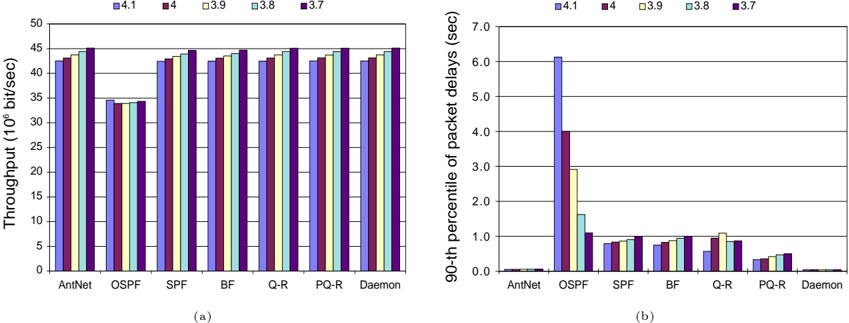
The image contains two bar charts comparing network protocol performance across different software versions (4.1, 4, 3.9, 3.8, 3.7). Chart (a) measures throughput (10⁶ bit/sec), while chart (b) measures 90th percentile packet delays (seconds). Both charts use color-coded bars to represent protocol versions, with spatial grounding of legends at the top of each chart.
### Components/Axes
**Chart (a): Throughput (10⁶ bit/sec)**
- **X-axis**: Protocols (AntNet, OSPF, SPF, BF, Q-R, PQ-R, Daemon)
- **Y-axis**: Throughput values (0–50 × 10⁶ bit/sec)
- **Legend**: Version colors (4.1: light blue, 4: dark red, 3.9: yellow, 3.8: light green, 3.7: dark purple)
- **Bar Structure**: Each protocol has 5 bars (one per version), ordered left-to-right by version number.
**Chart (b): 90th Percentile Packet Delays (sec)**
- **X-axis**: Same protocols as chart (a)
- **Y-axis**: Delay values (0–7 seconds)
- **Legend**: Same version colors as chart (a)
- **Bar Structure**: Identical to chart (a), with version-ordered bars per protocol.
### Detailed Analysis
**Chart (a) Trends**:
- **AntNet**: Highest throughput (42–45 × 10⁶ bit/sec) across all versions, with version 3.7 (dark purple) peaking at ~45.
- **OSPF**: Lowest throughput (33–35 × 10⁶ bit/sec), with version 3.7 slightly higher than others.
- **SPF/BF/Q-R/PQ-R**: Throughput ranges from 40–44 × 10⁶ bit/sec, with version 3.7 consistently highest.
- **Daemon**: Moderate throughput (~38–42 × 10⁶ bit/sec), version 3.7 highest.
**Chart (b) Trends**:
- **AntNet**: Near-zero delays (<0.1 sec) across all versions.
- **OSPF**: Highest delays (3.8–6.0 sec), with version 4.1 (light blue) peaking at ~6.0 sec.
- **SPF/BF/Q-R/PQ-R**: Delays range from 0.5–1.5 sec, with version 3.7 generally lowest.
- **Daemon**: Near-zero delays (<0.1 sec) across all versions.
### Key Observations
1. **Version Correlation**: Higher protocol versions (3.7–4.1) generally show improved throughput and reduced delays, except for OSPF.
2. **OSPF Anomaly**: OSPF exhibits disproportionately low throughput and high delays in newer versions, suggesting potential inefficiencies or bugs.
3. **Daemon Efficiency**: Daemon maintains near-optimal performance across all metrics and versions.
4. **AntNet Consistency**: AntNet shows stable, high throughput but minimal delay variation, indicating specialized optimization.
### Interpretation
The data suggests that newer protocol versions (3.7–4.1) generally enhance network performance, with Daemon and AntNet leading in efficiency. However, OSPF’s degraded performance in newer versions raises concerns about compatibility or implementation issues. The stark contrast between AntNet’s high throughput and low delays implies it may be optimized for specific use cases (e.g., high-speed data transfer), while OSPF’s anomalies warrant further investigation into version-specific optimizations or regressions. Daemon’s consistent performance across metrics highlights its robustness as a protocol choice.