## Bayesian Network and Correlation Graph Analysis
### Overview
The image contains two primary components:
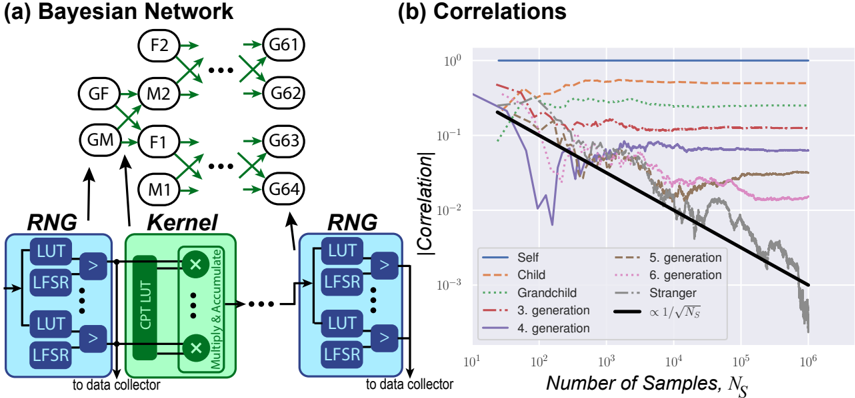
1. **(a) Bayesian Network**: A computational model depicting data flow through RNGs (Random Number Generators), a Kernel, and correlation calculations.
2. **(b) Correlation Graph**: A log-log plot showing correlation decay across different data relationships (self, child, grandchild, etc.) as a function of sample size.
---
### Components/Axes
#### Bayesian Network (a)
- **Nodes**:
- **Inputs**: `F1`, `F2`, `M1`, `M2` (feature/marker nodes).
- **Outputs**: `G61`, `G62`, `G63`, `G64` (generated data nodes).
- **Components**:
- **RNG (Left)**: Contains `LUT` (Look-Up Table) and `LFSR` (Linear Feedback Shift Register) blocks.
- **Kernel (Center)**: Processes data via `CPT LUT` (Conditional Probability Table Look-Up Table) and `Multiply & Accumulate` operations.
- **RNG (Right)**: Mirrors the left RNG structure.
- **Flow**:
- Data flows from `data collector` → Left RNG → Kernel → Right RNG → `data collector`.
- Arrows (`→`, `↑`, `↘`) indicate directional dependencies.
#### Correlation Graph (b)
- **Axes**:
- **X-axis**: `Number of Samples, N_S` (log scale: 10¹ to 10⁶).
- **Y-axis**: `Correlation` (log scale: 10⁻³ to 10⁰).
- **Legend**:
- **Lines**:
- `Self` (solid blue): Self-correlation.
- `Child` (dashed orange): Parent-child correlation.
- `Grandchild` (dotted green): Grandparent-grandchild correlation.
- `3rd generation` (dash-dot red): Three-generation correlation.
- `4th generation` (dash-dot purple): Four-generation correlation.
- `6th generation` (dotted pink): Six-generation correlation.
- `Stranger` (gray): Unrelated data correlation.
- `1/√N_S` (black dashed): Theoretical decay threshold.
---
### Detailed Analysis
#### Bayesian Network
- **RNG Blocks**:
- Both RNGs use `LUT` and `LFSR` for pseudo-random number generation.
- Left RNG feeds into the Kernel; Right RNG receives processed data.
- **Kernel**:
- Combines inputs via `CPT LUT` and arithmetic operations (`×`, `+`).
- Outputs to the Right RNG for final data generation.
#### Correlation Graph
- **Trends**:
- **Self (blue)**: Maintains near-constant correlation (~10⁰) across all sample sizes.
- **Child (orange)**: Starts at ~10⁻¹, decays to ~10⁻² by 10⁵ samples.
- **Grandchild (green)**: Begins at ~10⁻¹, stabilizes near ~10⁻².
- **3rd/4th/6th generations**: Show gradual decay, with 6th generation dropping below 10⁻².
- **Stranger (gray)**: Sharp initial drop to ~10⁻³, then plateaus.
- **Theoretical (black)**: Follows `1/√N_S`, intersecting most lines at ~10³ samples.
---
### Key Observations
1. **Self-correlation** remains dominant, unaffected by sample size.
2. **Stranger correlation** decays fastest, aligning closely with the theoretical `1/√N_S` line.
3. **Generational correlations** (Child, Grandchild, etc.) decay slower than strangers but faster than self.
4. **6th generation** exhibits the weakest correlation, suggesting diminishing relatedness over generations.
---
### Interpretation
1. **Bayesian Network**:
- Models a closed-loop system where data is processed through RNGs and a Kernel, likely simulating stochastic processes or cryptographic operations.
- The dual RNGs and Kernel suggest a focus on data transformation and correlation analysis.
2. **Correlation Graph**:
- Demonstrates that **self-similarity** (e.g., identical data) persists regardless of sample size, while **relatedness** (e.g., parent-child) decays predictably.
- The `1/√N_S` line validates the expected decay rate for uncorrelated data, confirming that stranger correlations align with randomness.
- **Generational decay** implies that shared patterns (e.g., genetic, behavioral) weaken over time, consistent with entropy principles.
3. **Anomalies**:
- The `Stranger` line’s sharp initial drop suggests strong initial dissimilarity, possibly due to data preprocessing or inherent randomness.
- The `6th generation` line’s divergence from the theoretical curve may indicate residual correlations in long-term data.
---
### Conclusion
The Bayesian Network and correlation graph together illustrate a system where data relationships (self, generational, stranger) are quantified and modeled. The decay trends align with theoretical expectations, validating the network’s ability to simulate and analyze complex dependencies. This could apply to fields like cryptography, genetics, or machine learning, where understanding data similarity is critical.