## Bayesian Network and Correlations
### Overview
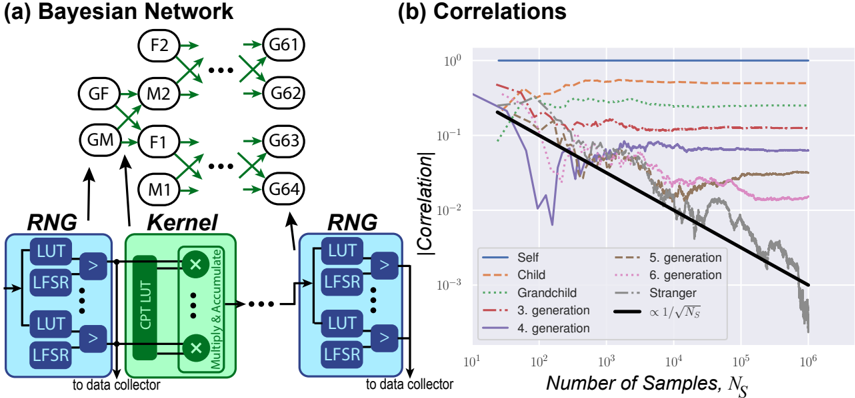
The image presents two diagrams: (a) a Bayesian Network illustrating relationships between family members, and (b) a plot showing the correlation between individuals as a function of the number of samples.
### Components/Axes
#### (a) Bayesian Network
* **Title:** (a) Bayesian Network
* **Nodes:** Represented by circles, labeled as F2, GF, GM, M2, F1, M1, G61, G62, G63, G64. These likely represent family members (e.g., GF = Grandfather, GM = Grandmother, F = Father, M = Mother, G = Generation).
* **Edges:** Green arrows indicating probabilistic dependencies between nodes.
* **RNG (Random Number Generator) Blocks:** Two blue blocks labeled "RNG" containing "LUT" (Look-Up Table) and "LFSR" (Linear Feedback Shift Register) components. Arrows point from these blocks to the Bayesian Network. Text "to data collector" is present below each RNG block.
* **Kernel Block:** A green block labeled "Kernel" containing "CPT LUT" (Conditional Probability Table Look-Up Table) and "Multiply & Accumulate" components. An arrow points from this block to the Bayesian Network.
#### (b) Correlations
* **Title:** (b) Correlations
* **Y-axis:** |Correlation|, logarithmic scale from 10^-3 to 10^0.
* **X-axis:** Number of Samples, N_s, logarithmic scale from 10^1 to 10^6.
* **Legend:** Located in the bottom-center of the plot.
* Self (solid blue line)
* Child (dashed red line)
* Grandchild (dotted green line)
* 3. generation (dash-dot red line)
* 4. generation (solid purple line)
* 5. generation (dashed gray line)
* 6. generation (dotted pink line)
* Stranger (dash-dot gray line)
* ∝ 1/√N_s (solid black line)
### Detailed Analysis
#### (a) Bayesian Network
The Bayesian network shows a hierarchical structure. The RNG and Kernel blocks feed into the network, suggesting they provide the initial data or parameters for the probabilistic relationships. The arrows indicate the flow of influence between family members.
* RNG blocks contain "LUT" and "LFSR" components.
* Kernel block contains "CPT LUT" and "Multiply & Accumulate" components.
#### (b) Correlations
The plot shows how the correlation between individuals changes as the number of samples increases.
* **Self (solid blue line):** Remains constant at approximately 1.
* **Child (dashed red line):** Starts around 0.3 and remains relatively constant.
* **Grandchild (dotted green line):** Starts around 0.2 and remains relatively constant.
* **3. generation (dash-dot red line):** Starts around 0.1 and remains relatively constant.
* **4. generation (solid purple line):** Starts around 0.05, decreases sharply until ~10^3 samples, then fluctuates around 0.01.
* **5. generation (dashed gray line):** Starts around 0.05, decreases sharply until ~10^3 samples, then fluctuates around 0.01.
* **6. generation (dotted pink line):** Starts around 0.05, decreases sharply until ~10^3 samples, then fluctuates around 0.01.
* **Stranger (dash-dot gray line):** Starts around 0.05, decreases sharply until ~10^3 samples, then fluctuates around 0.01.
* **∝ 1/√N_s (solid black line):** A reference line showing a decay proportional to the inverse square root of the number of samples. This line serves as a benchmark for how correlation should decrease with increasing sample size if the correlation is due to random chance.
### Key Observations
* The correlation for "Self" remains constant at 1, as expected.
* The correlation decreases as the generational distance increases (Child > Grandchild > 3rd Generation).
* For generations beyond the 3rd, the correlation decreases sharply initially and then fluctuates around a low value.
* The correlation decay for distant generations (4th, 5th, 6th, Stranger) roughly follows the ∝ 1/√N_s trend after an initial drop.
### Interpretation
The Bayesian Network illustrates the relationships between family members, while the correlation plot quantifies the strength of these relationships as a function of the number of samples. The plot demonstrates that correlation decreases with generational distance, indicating that closer relatives have stronger correlations. The decay of correlation for distant relatives follows the ∝ 1/√N_s trend, suggesting that the observed correlation is largely due to random chance and decreases as more data is collected. The RNG and Kernel blocks in the Bayesian Network likely represent the mechanisms by which the data is generated and processed to calculate these correlations.