\n
## Line Chart: Satisfied Clauses Comparison
### Overview
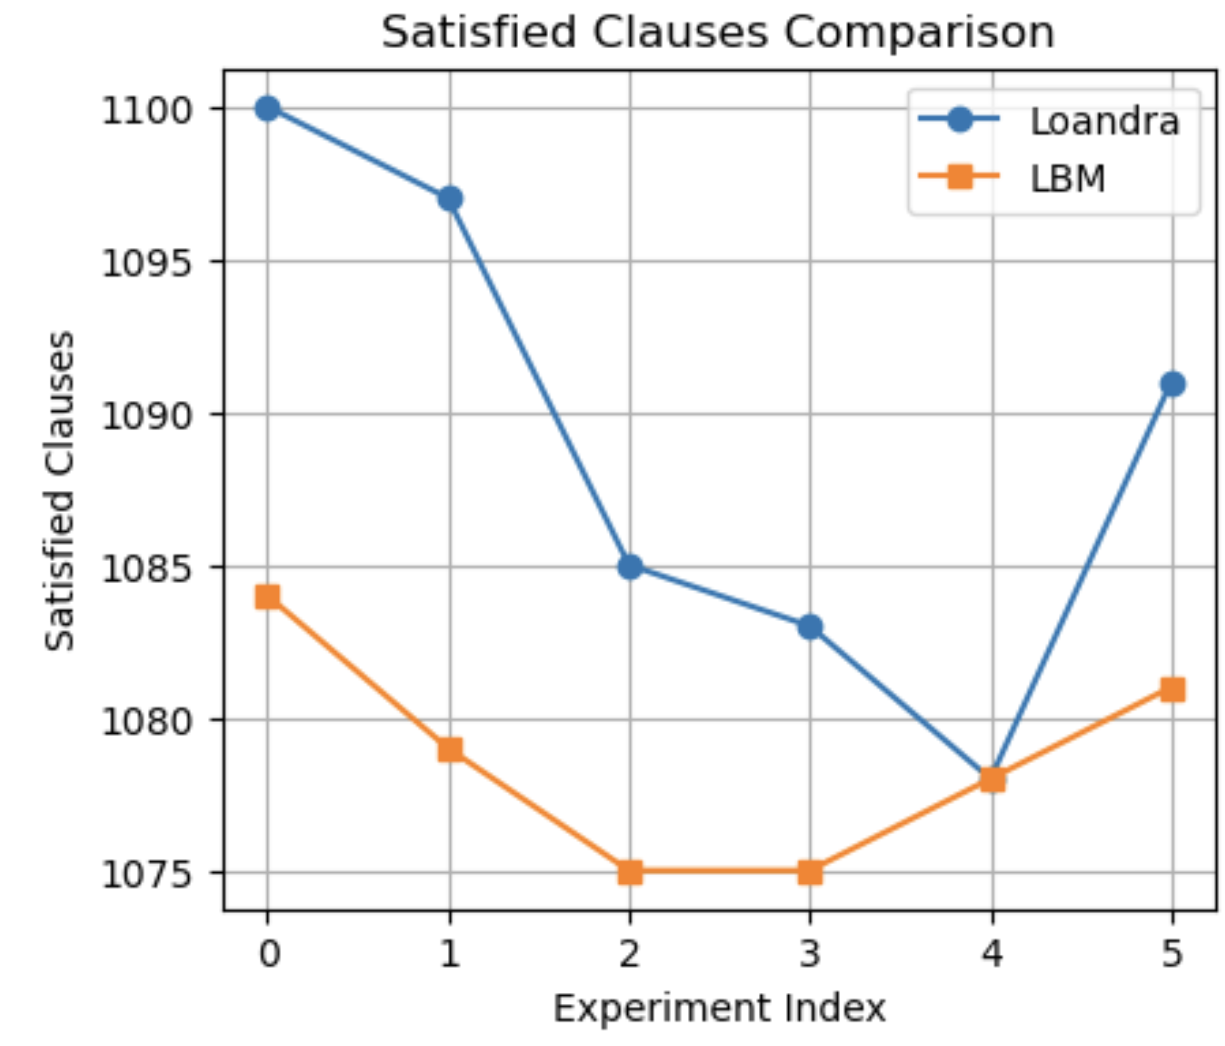
This line chart compares the number of satisfied clauses for two algorithms, Loandra and LBM, across six experiments. The x-axis represents the experiment index, ranging from 0 to 5, and the y-axis represents the number of satisfied clauses.
### Components/Axes
* **Title:** Satisfied Clauses Comparison
* **X-axis Label:** Experiment Index
* **Y-axis Label:** Satisfied Clauses
* **Legend:**
* Loandra (Blue Line with Circle Markers)
* LBM (Orange Line with Triangle Markers)
* **X-axis Markers:** 0, 1, 2, 3, 4, 5
* **Y-axis Scale:** Approximately 1075 to 1100, with gridlines at intervals of 5.
### Detailed Analysis
**Loandra (Blue Line):**
The Loandra line starts at approximately 1100 satisfied clauses at Experiment Index 0. It then exhibits a steep downward trend, decreasing to approximately 1096 at Index 1, then to approximately 1087 at Index 2. It continues to decrease to approximately 1083 at Index 3, then slightly increases to approximately 1085 at Index 4, and finally increases to approximately 1091 at Index 5.
* Experiment 0: ~1100 satisfied clauses
* Experiment 1: ~1096 satisfied clauses
* Experiment 2: ~1087 satisfied clauses
* Experiment 3: ~1083 satisfied clauses
* Experiment 4: ~1085 satisfied clauses
* Experiment 5: ~1091 satisfied clauses
**LBM (Orange Line):**
The LBM line begins at approximately 1085 satisfied clauses at Experiment Index 0. It decreases to approximately 1080 at Index 1, then to approximately 1076 at Index 2. It then decreases to approximately 1075 at Index 3, increases to approximately 1078 at Index 4, and finally increases to approximately 1081 at Index 5.
* Experiment 0: ~1085 satisfied clauses
* Experiment 1: ~1080 satisfied clauses
* Experiment 2: ~1076 satisfied clauses
* Experiment 3: ~1075 satisfied clauses
* Experiment 4: ~1078 satisfied clauses
* Experiment 5: ~1081 satisfied clauses
### Key Observations
* Loandra consistently outperforms LBM in terms of satisfied clauses across all experiment indices.
* Loandra exhibits a more significant fluctuation in the number of satisfied clauses compared to LBM.
* Both algorithms show a general decreasing trend in satisfied clauses from Experiment Index 0 to Experiment Index 3, followed by a slight increase.
* The largest drop in satisfied clauses for Loandra occurs between Experiment Index 0 and Experiment Index 1.
* The lowest point for LBM is at Experiment Index 3.
### Interpretation
The data suggests that the Loandra algorithm generally achieves a higher number of satisfied clauses than the LBM algorithm across the tested experiments. The initial drop in performance for both algorithms could be due to the algorithm converging to a local optimum or encountering more challenging problem instances as the experiment index increases. The slight recovery in performance towards the end of the experiments might indicate that the algorithms are adapting or finding better solutions with further iterations. The larger fluctuations observed in Loandra's performance could suggest that it is more sensitive to the specific characteristics of each experiment or that it has a higher variance in its search process. Further investigation would be needed to understand the underlying reasons for these differences and to determine which algorithm is more robust and efficient in different scenarios.