## Horizontal Bar Chart: Attack Types vs. RtA
### Overview
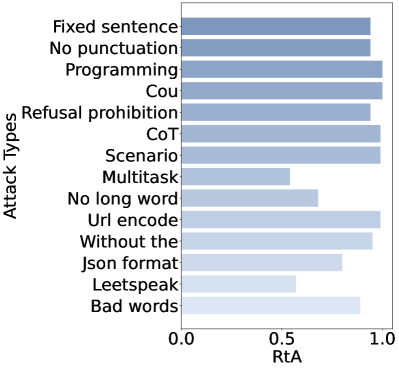
The image is a horizontal bar chart comparing different attack types based on their RtA (likely representing some kind of success rate or effectiveness). The y-axis lists the attack types, and the x-axis represents the RtA values, ranging from 0.0 to 1.0. The bars are shaded in a gradient of blue, with darker shades indicating higher RtA values.
### Components/Axes
* **Y-axis:** "Attack Types" - Categorical axis listing different attack types.
* Attack Types (from top to bottom): Fixed sentence, No punctuation, Programming, Cou, Refusal prohibition, CoT, Scenario, Multitask, No long word, Url encode, Without the, Json format, Leetspeak, Bad words
* **X-axis:** "RtA" - Numerical axis ranging from 0.0 to 1.0, with tick marks at 0.0, 0.5, and 1.0.
### Detailed Analysis
Here's a breakdown of the RtA values for each attack type, along with their visual trend:
* **Fixed sentence:** RtA ≈ 0.95. (Darkest blue, near the 1.0 mark)
* **No punctuation:** RtA ≈ 0.90. (Dark blue, close to 1.0)
* **Programming:** RtA ≈ 0.98. (Darkest blue, very close to 1.0)
* **Cou:** RtA ≈ 0.92. (Dark blue, close to 1.0)
* **Refusal prohibition:** RtA ≈ 0.85. (Medium-dark blue)
* **CoT:** RtA ≈ 0.95. (Darkest blue, near the 1.0 mark)
* **Scenario:** RtA ≈ 0.93. (Dark blue, close to 1.0)
* **Multitask:** RtA ≈ 0.55. (Light blue, slightly above the 0.5 mark)
* **No long word:** RtA ≈ 0.65. (Light blue, between 0.5 and 1.0)
* **Url encode:** RtA ≈ 0.90. (Dark blue, close to 1.0)
* **Without the:** RtA ≈ 0.75. (Medium blue)
* **Json format:** RtA ≈ 0.70. (Medium-light blue)
* **Leetspeak:** RtA ≈ 0.50. (Light blue, at the 0.5 mark)
* **Bad words:** RtA ≈ 0.78. (Medium blue)
### Key Observations
* Attack types "Programming", "Fixed sentence", and "CoT" have the highest RtA values, close to 1.0.
* Attack types "Multitask" and "Leetspeak" have the lowest RtA values, around 0.5.
* There is a significant range in RtA values across the different attack types, indicating varying degrees of effectiveness.
### Interpretation
The chart suggests that certain attack types are significantly more effective (higher RtA) than others. "Programming", "Fixed sentence", and "CoT" attacks appear to be the most successful, while "Multitask" and "Leetspeak" attacks are the least successful. This information could be used to prioritize resources and focus on mitigating the most effective attack types. The RtA metric likely represents the rate at which these attacks are successful in achieving a specific goal, such as bypassing security measures or eliciting a desired response.