## Bar Chart: Easy Difficulty (Solved Trials Only)
### Overview
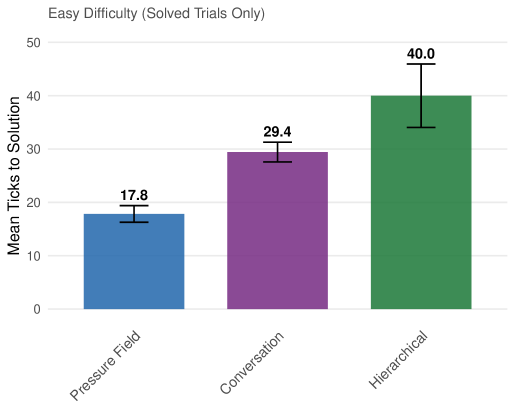
The image is a bar chart comparing the mean number of ticks to solution for three different problem types: Pressure Field, Conversation, and Hierarchical. The chart displays data for trials of "Easy" difficulty that were successfully solved. Error bars are included on each bar, representing the variability in the data.
### Components/Axes
* **Title:** Easy Difficulty (Solved Trials Only)
* **Y-axis:** Mean Ticks to Solution, with a scale from 0 to 50 in increments of 10.
* **X-axis:** Categorical axis representing the problem types: Pressure Field, Conversation, and Hierarchical.
* **Bars:** Three bars, each representing a problem type.
* Pressure Field: Blue
* Conversation: Purple
* Hierarchical: Green
* **Error Bars:** Black vertical lines extending above and below the top of each bar, indicating the standard error or similar measure of variability.
### Detailed Analysis
* **Pressure Field (Blue):** The mean ticks to solution is 17.8. The error bar extends approximately 2 ticks above and below this value.
* **Conversation (Purple):** The mean ticks to solution is 29.4. The error bar extends approximately 2 ticks above and below this value.
* **Hierarchical (Green):** The mean ticks to solution is 40.0. The error bar extends approximately 6 ticks above and below this value.
### Key Observations
* The Hierarchical problem type has the highest mean ticks to solution, followed by Conversation, and then Pressure Field.
* The error bar for the Hierarchical problem type is larger than the error bars for the other two problem types, suggesting greater variability in the number of ticks required to solve this type of problem.
### Interpretation
The bar chart suggests that, on average, the Hierarchical problem type is the most difficult to solve (requires the most ticks), followed by the Conversation problem type, and then the Pressure Field problem type. The larger error bar for the Hierarchical problem type indicates that the difficulty of this problem type may vary more from trial to trial compared to the other two problem types. The data is limited to "Easy" difficulty trials that were successfully solved, so it does not provide information about the difficulty of unsolved trials or trials of other difficulty levels.