\n
## Bar Chart: Mean Ticks to Solution for Different Interaction Methods (Easy Difficulty)
### Overview
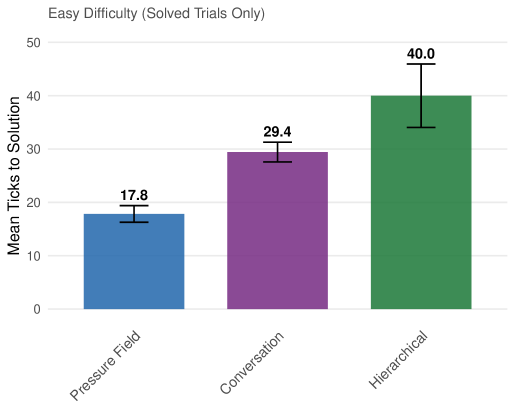
This bar chart displays the mean number of ticks to solution for three different interaction methods – Pressure Field, Conversation, and Hierarchical – on tasks of easy difficulty. Error bars are included for each method, indicating the variability in the data. The chart title is "Easy Difficulty (Solved Trials Only)".
### Components/Axes
* **X-axis:** Interaction Method (Pressure Field, Conversation, Hierarchical)
* **Y-axis:** Mean Ticks to Solution (Scale from 0 to 50, increments of 10)
* **Bars:** Represent the mean ticks to solution for each interaction method.
* **Error Bars:** Represent the standard error or standard deviation of the mean.
* **Title:** "Easy Difficulty (Solved Trials Only)" – positioned at the top-center of the chart.
### Detailed Analysis
The chart consists of three bars, each representing a different interaction method. The height of each bar corresponds to the mean ticks to solution, with error bars indicating the variability.
* **Pressure Field:** The bar is blue. The trend is flat. The mean ticks to solution is approximately 17.8, with an error bar extending from roughly 15 to 20.
* **Conversation:** The bar is purple. The trend is flat. The mean ticks to solution is approximately 29.4, with an error bar extending from roughly 26 to 32.
* **Hierarchical:** The bar is green. The trend is flat. The mean ticks to solution is approximately 40.0, with an error bar extending from roughly 35 to 45.
### Key Observations
* The Hierarchical method has the highest mean ticks to solution, significantly higher than the other two methods.
* The Pressure Field method has the lowest mean ticks to solution.
* The error bars suggest that the Hierarchical method has the greatest variability in ticks to solution.
* The data only includes solved trials.
### Interpretation
The data suggests that, for tasks of easy difficulty, the Hierarchical interaction method requires the most effort (measured in ticks to solution) compared to Pressure Field and Conversation. The Pressure Field method appears to be the most efficient. The larger error bars for the Hierarchical method indicate that the performance with this method is more variable, potentially suggesting that some users find it much easier or harder than others. The fact that only solved trials are included means that the chart doesn't reflect the time taken to *attempt* a solution, only the time taken to *complete* one. This could bias the results, as methods that lead to more failures might be underrepresented. The difference in ticks to solution could be due to the inherent complexity of each interaction method, or the suitability of each method for the type of task presented. Further investigation would be needed to determine the underlying reasons for these differences.