## Bar Chart: Easy Difficulty (Solved Trials Only)
### Overview
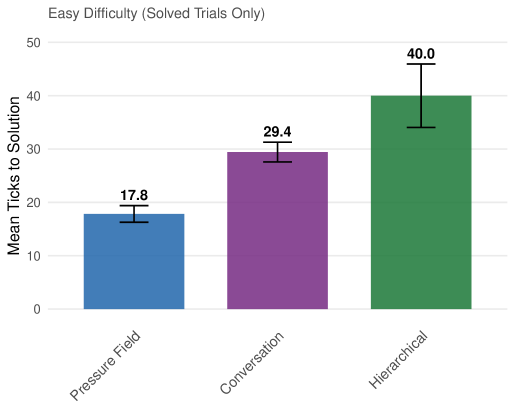
The chart visualizes the mean number of "ticks to solution" for three puzzle difficulty categories: Pressure Field, Conversation, and Hierarchical. Data is presented as vertical bars with error bars indicating uncertainty. The y-axis represents the mean ticks to solution, while the x-axis categorizes puzzle types.
### Components/Axes
- **Title**: "Easy Difficulty (Solved Trials Only)"
- **X-Axis**: Labeled "Puzzle Type" with categories:
- Pressure Field (blue bar)
- Conversation (purple bar)
- Hierarchical (green bar)
- **Y-Axis**: Labeled "Mean Ticks to Solution" with a scale from 0 to 50.
- **Legend**: Located at the bottom-right, associating colors with categories:
- Blue = Pressure Field
- Purple = Conversation
- Green = Hierarchical
- **Error Bars**: Vertical lines atop each bar showing uncertainty ranges.
### Detailed Analysis
1. **Pressure Field** (blue):
- Mean ticks: **17.8** (±1.2)
- Error bar spans 16.6 to 19.0.
2. **Conversation** (purple):
- Mean ticks: **29.4** (±1.5)
- Error bar spans 27.9 to 30.9.
3. **Hierarchical** (green):
- Mean ticks: **40.0** (±3.0)
- Error bar spans 37.0 to 43.0.
### Key Observations
- **Increasing Difficulty Trend**: Mean ticks to solution rise consistently from Pressure Field (17.8) to Hierarchical (40.0).
- **Error Bar Variability**: Hierarchical trials show the largest uncertainty (±3.0), suggesting greater variability in participant performance.
- **Scale Proportions**: The y-axis spans 0–50, with bars occupying ~20% (Pressure Field), ~30% (Conversation), and ~40% (Hierarchical) of the axis.
### Interpretation
The data demonstrates a clear correlation between puzzle difficulty and cognitive effort (measured as ticks to solution). As difficulty increases from Pressure Field to Hierarchical, participants require significantly more attempts to solve puzzles. The Hierarchical category’s larger error bar implies that this difficulty level introduced greater variability in problem-solving strategies or participant skill levels. The "Solved Trials Only" constraint suggests the data excludes unsolved attempts, potentially skewing results toward successful outcomes. This chart could inform UX design or educational material difficulty calibration by quantifying the cognitive load of different puzzle structures.