## Stacked Bar Chart: Processing Time Allocation Across Task
### Overview
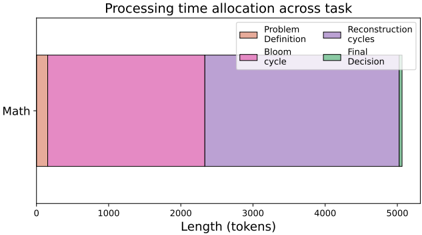
The image is a stacked bar chart illustrating the processing time allocation across a task, specifically for "Math". The chart breaks down the total processing time into four components: Problem Definition, Bloom cycle, Reconstruction cycles, and Final Decision. The x-axis represents the length in tokens, and the y-axis represents the task (Math).
### Components/Axes
* **Title:** Processing time allocation across task
* **Y-axis:** Task - "Math"
* **X-axis:** Length (tokens), with scale markers at 0, 1000, 2000, 3000, 4000, and 5000.
* **Legend:** Located in the top-right corner.
* Problem Definition (light orange)
* Bloom cycle (pink)
* Reconstruction cycles (light purple)
* Final Decision (light green)
### Detailed Analysis
The bar represents the total processing time for the "Math" task, segmented into the four phases.
* **Problem Definition:** The light orange segment starts at 0 and extends to approximately 200 tokens.
* **Bloom cycle:** The pink segment starts at approximately 200 tokens and extends to approximately 2200 tokens.
* **Reconstruction cycles:** The light purple segment starts at approximately 2200 tokens and extends to approximately 5000 tokens.
* **Final Decision:** The light green segment starts at approximately 5000 tokens and extends to approximately 5100 tokens.
### Key Observations
* The "Reconstruction cycles" phase consumes the most processing time, accounting for a significant portion of the total length (tokens).
* The "Bloom cycle" phase is the second largest consumer of processing time.
* The "Problem Definition" and "Final Decision" phases consume relatively little processing time compared to the other two phases.
### Interpretation
The chart provides a breakdown of the processing time allocation for the "Math" task, highlighting the relative importance of each phase. The "Reconstruction cycles" phase dominates the processing time, suggesting that this phase is the most computationally intensive or complex. The "Bloom cycle" also contributes significantly to the overall processing time. The "Problem Definition" and "Final Decision" phases are relatively quick, indicating that these phases are less demanding in terms of processing resources. This information could be used to optimize the processing pipeline by focusing on improving the efficiency of the "Reconstruction cycles" and "Bloom cycle" phases.