\n
## Stacked Bar Chart: Processing time allocation across task
### Overview
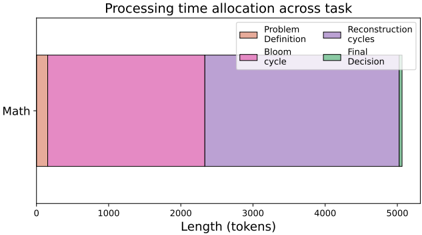
The image presents a stacked bar chart illustrating the processing time allocation across a task, specifically "Math". The chart displays the breakdown of time spent in different phases: Problem Definition, Bloom cycle, Reconstruction cycles, and Final Decision, measured in "Length (tokens)".
### Components/Axes
* **Title:** "Processing time allocation across task" (centered at the top)
* **Y-axis:** Labelled "Math" (left side, vertical) - representing the task type.
* **X-axis:** Labelled "Length (tokens)" (bottom, horizontal) - representing the processing time. Scale ranges from 0 to 5000 tokens.
* **Legend:** Located in the top-right corner. Contains the following labels with corresponding colors:
* Problem Definition (light brown)
* Bloom cycle (pink)
* Reconstruction cycles (light purple)
* Final Decision (light green)
### Detailed Analysis
The chart consists of a single stacked bar representing the "Math" task. The bar is segmented into four colored sections corresponding to the phases defined in the legend.
* **Problem Definition:** The light brown segment starts at 0 tokens and extends to approximately 200 tokens.
* **Bloom cycle:** The pink segment begins at approximately 200 tokens and extends to approximately 2300 tokens.
* **Reconstruction cycles:** The light purple segment starts at approximately 2300 tokens and extends to approximately 4800 tokens.
* **Final Decision:** The light green segment starts at approximately 4800 tokens and extends to approximately 5000 tokens.
### Key Observations
* The majority of processing time for the "Math" task is spent in the "Reconstruction cycles" phase, accounting for roughly 76% of the total time.
* The "Bloom cycle" phase accounts for approximately 42% of the total time.
* The "Problem Definition" phase represents a small fraction of the total time, approximately 4%.
* The "Final Decision" phase also represents a small fraction of the total time, approximately 4%.
### Interpretation
The chart suggests that solving the "Math" task is heavily reliant on iterative refinement and reconstruction, as evidenced by the dominant "Reconstruction cycles" segment. The relatively small time spent on "Problem Definition" indicates that the initial understanding of the problem is quickly established. The "Bloom cycle" represents a significant portion of the processing time, suggesting a substantial amount of exploration and generation of potential solutions. The minimal time allocated to "Final Decision" implies that the selection of the final solution is relatively straightforward once the reconstruction phase is complete.
The data highlights a workflow where initial problem understanding is followed by a substantial period of iterative refinement and solution building, culminating in a quick final decision. This could indicate a complex problem space where multiple iterations are necessary to converge on an optimal solution.