## Horizontal Stacked Bar Chart: Processing time allocation across task
### Overview
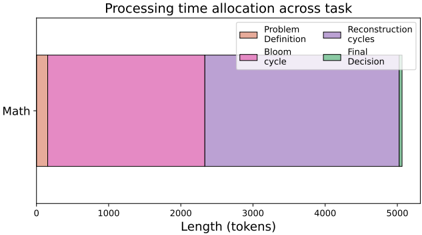
The image displays a single horizontal stacked bar chart titled "Processing time allocation across task." It visualizes the distribution of processing effort, measured in tokens, across four distinct phases for a task labeled "Math." The chart is designed to show the proportional allocation of resources or time to different sub-processes within this task.
### Components/Axes
* **Chart Title:** "Processing time allocation across task" (centered at the top).
* **Y-Axis:** Contains a single categorical label: "Math" (positioned on the left side, vertically centered relative to the bar).
* **X-Axis:** Labeled "Length (tokens)" (centered at the bottom). The axis has numerical markers at 0, 1000, 2000, 3000, 4000, and 5000.
* **Legend:** Located in the top-right corner of the chart area. It defines four categories with corresponding color swatches:
* **Problem Definition:** Light orange/peach color.
* **Bloom Cycle:** Pink color.
* **Reconstruction cycles:** Light purple/lavender color.
* **Final Decision:** Green color.
* **Data Bar:** A single horizontal bar corresponding to the "Math" task. It is segmented from left to right according to the legend categories.
### Detailed Analysis
The bar for the "Math" task is divided into four contiguous segments. The approximate token length for each segment, read from the x-axis, is as follows:
1. **Problem Definition (Light Orange):** This is the leftmost and smallest segment. It starts at 0 and extends to approximately **100 tokens**.
2. **Bloom Cycle (Pink):** This segment begins where Problem Definition ends (~100 tokens) and extends to approximately **2300 tokens**. Its length is therefore about **2200 tokens**.
3. **Reconstruction cycles (Light Purple):** This is the largest segment. It starts at ~2300 tokens and extends to the end of the bar, which aligns with the **5000 token** mark on the x-axis. Its length is therefore approximately **2700 tokens**.
4. **Final Decision (Green):** This is the rightmost and thinnest segment. It appears as a very narrow sliver at the very end of the bar, starting at 5000 tokens. Its length is minimal, estimated at **less than 50 tokens**, possibly around **10-20 tokens**.
**Trend Verification:** The visual trend shows a clear progression: a very brief initial phase (Problem Definition), followed by a substantial phase (Bloom Cycle), then the dominant phase (Reconstruction cycles), and concluding with an extremely brief final phase (Final Decision). The Bloom Cycle and Reconstruction cycles together constitute the vast majority of the token allocation.
### Key Observations
* **Dominant Phase:** The "Reconstruction cycles" phase consumes the largest portion of the processing length, accounting for over half (~54%) of the total 5000 tokens.
* **Secondary Phase:** The "Bloom Cycle" is the second-largest component, taking up a significant portion (~44%) of the total.
* **Minimal Phases:** Both "Problem Definition" and "Final Decision" are very small in comparison, together making up less than 3% of the total allocation. "Final Decision" is notably the smallest component.
* **Total Length:** The entire process for the "Math" task sums to approximately **5000 tokens**.
### Interpretation
This chart provides a quantitative breakdown of the computational or cognitive effort required for a "Math" task, framed as a sequence of processing stages. The data suggests that the core of the work lies in iterative or recursive processes.
* The substantial "Bloom Cycle" likely represents an expansive, exploratory phase—such as generating multiple solution paths, hypotheses, or intermediate steps.
* The even larger "Reconstruction cycles" phase implies a significant effort in refining, verifying, assembling, or backtracking through the outputs of the Bloom Cycle. This could involve error correction, logical consistency checks, or structuring the final answer from intermediate components.
* The minimal time spent on "Problem Definition" suggests the task's parameters are quickly established.
* The negligible "Final Decision" phase indicates that once the reconstruction is complete, selecting or formatting the final output is a trivial step.
**Overall Implication:** For this modeled "Math" task, the process is not linear but heavily weighted towards iterative refinement and synthesis (Bloom + Reconstruction). The efficiency of the overall process is therefore critically dependent on the performance of these two middle stages, particularly the Reconstruction cycles. The chart argues that the "thinking" or "solving" happens predominantly in the middle, not at the beginning or end.