## Bar Chart: Processing time allocation across task
### Overview
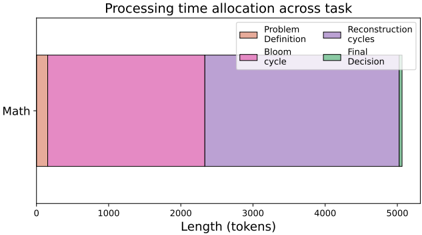
The image is a horizontal bar chart visualizing the distribution of processing time (measured in tokens) across four distinct tasks within a "Math" category. The chart uses color-coded bars to represent different stages of processing, with a legend in the top-right corner for reference.
### Components/Axes
- **Title**: "Processing time allocation across task"
- **X-axis**: "Length (tokens)" with a scale from 0 to 5000 in increments of 1000.
- **Y-axis**: A single category labeled "Math."
- **Legend**: Located in the top-right corner, mapping colors to tasks:
- **Orange**: Problem Definition
- **Pink**: Bloom cycle
- **Purple**: Reconstruction cycles
- **Green**: Final Decision
### Detailed Analysis
- **Problem Definition (Orange)**: The shortest bar, spanning approximately **200 tokens**.
- **Bloom cycle (Pink)**: The second-longest bar, spanning approximately **2000 tokens**.
- **Reconstruction cycles (Purple)**: The longest bar, spanning approximately **4800 tokens**.
- **Final Decision (Green)**: The shortest bar, spanning approximately **10 tokens**.
### Key Observations
1. **Dominance of Reconstruction Cycles**: The purple bar (Reconstruction cycles) occupies ~68% of the total processing time (4800/7010 tokens), indicating it is the most time-intensive phase.
2. **Minimal Final Decision Time**: The green bar (Final Decision) is nearly negligible (~0.14% of total time), suggesting it is either highly optimized or not a bottleneck.
3. **Bloom Cycle Proportion**: The pink bar (Bloom cycle) accounts for ~28.5% of total time, making it the second-largest contributor.
4. **Problem Definition Efficiency**: The orange bar (Problem Definition) represents ~2.85% of total time, indicating it is the least resource-intensive phase.
### Interpretation
The data suggests that the majority of computational resources are allocated to **Reconstruction cycles**, which may reflect either inherent complexity in this phase or potential inefficiencies in its implementation. The near-absence of time spent on **Final Decision** could imply either a streamlined process or a design choice to minimize overhead in this stage. The **Bloom cycle** and **Problem Definition** phases occupy intermediate and minimal proportions, respectively, highlighting possible opportunities for optimization in the Reconstruction cycles to improve overall efficiency. The stark contrast between the purple and green bars raises questions about whether the Final Decision phase is intentionally under-resourced or if it could benefit from additional attention without compromising performance.