## Behavioural Models and Equations
### Overview
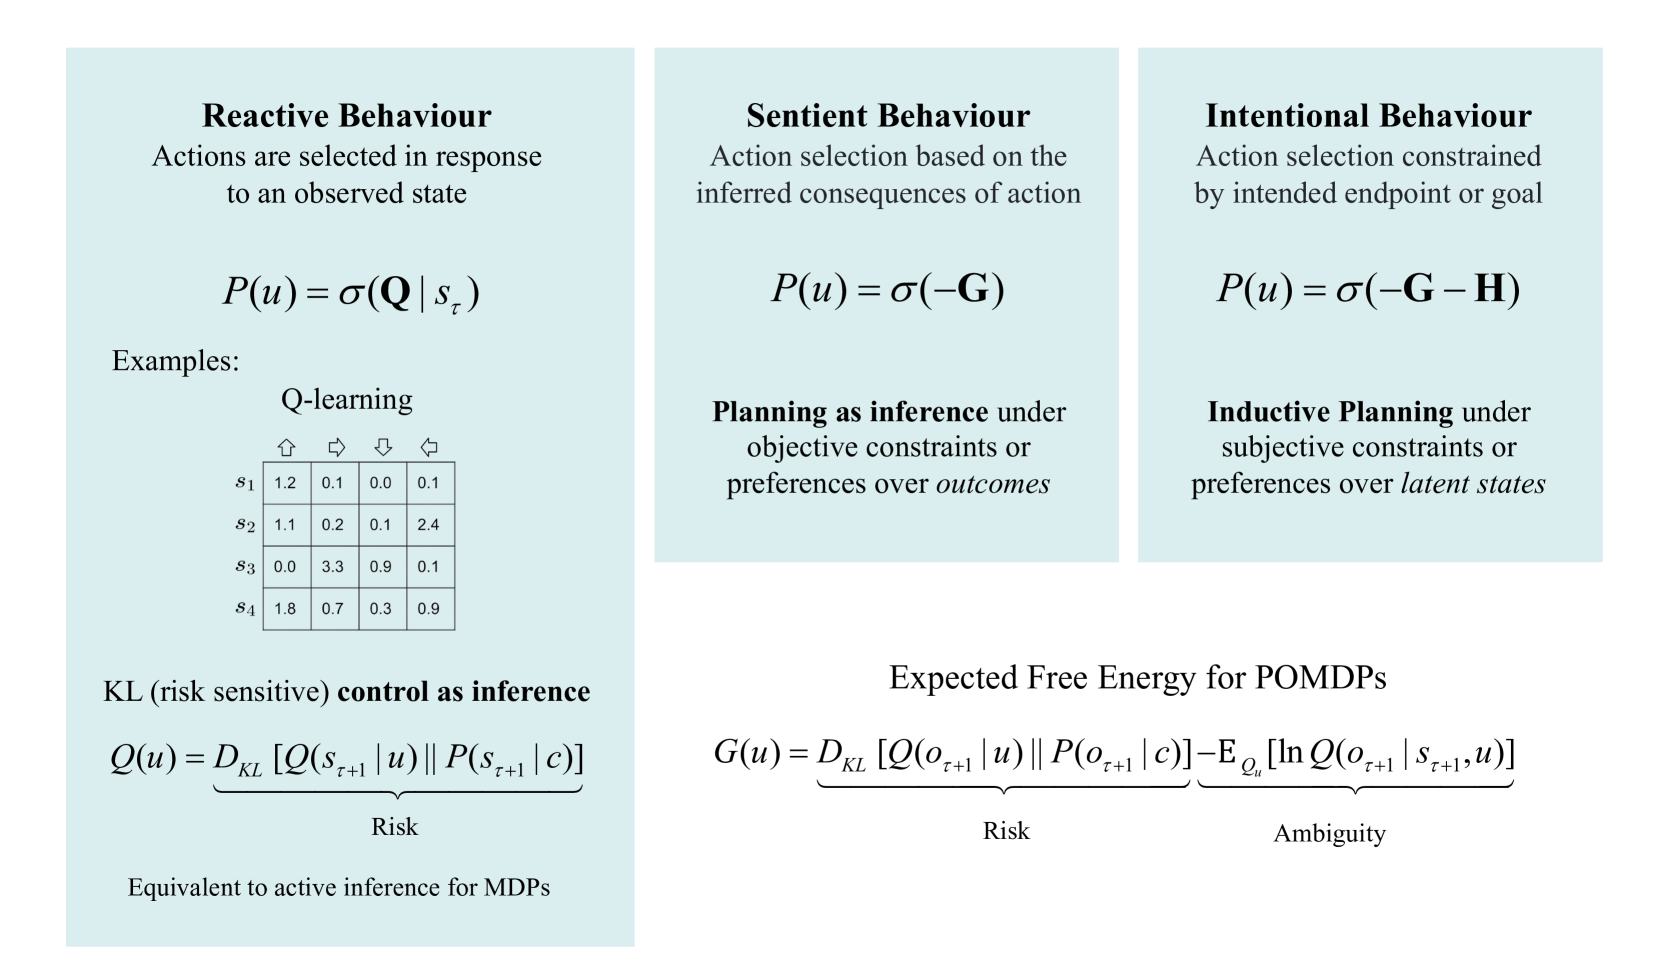
The image presents three different behavioral models: Reactive, Sentient, and Intentional. Each model is described with a brief explanation, a mathematical equation, and a further description. The image also includes equations for KL control as inference and expected free energy for POMDPs.
### Components/Axes
* **Reactive Behaviour:**
* Description: Actions are selected in response to an observed state.
* Equation: P(u) = σ(Q | s\_τ)
* Example: Q-learning table with states (s1, s2, s3, s4) and actions (up, right, down, left).
* **Sentient Behaviour:**
* Description: Action selection based on the inferred consequences of action.
* Equation: P(u) = σ(-G)
* Further Description: Planning as inference under objective constraints or preferences over outcomes.
* **Intentional Behaviour:**
* Description: Action selection constrained by intended endpoint or goal.
* Equation: P(u) = σ(-G - H)
* Further Description: Inductive Planning under subjective constraints or preferences over latent states.
* **KL (risk sensitive) control as inference:**
* Equation: Q(u) = D\_KL [Q(s\_{τ+1} | u) || P(s\_{τ+1} | c)]
* Label: Risk
* Description: Equivalent to active inference for MDPs
* **Expected Free Energy for POMDPs:**
* Equation: G(u) = D\_KL [Q(o\_{τ+1} | u) || P(o\_{τ+1} | c)] - E\_{Q\_u} [ln Q(o\_{τ+1} | s\_{τ+1}, u)]
* Label: Risk
* Label: Ambiguity
### Detailed Analysis or ### Content Details
* **Reactive Behaviour - Q-learning Example:**
* The Q-learning example is presented as a table. The rows represent states (s1, s2, s3, s4), and the columns represent actions (up, right, down, left). The values in the table represent Q-values.
* s1: Up (1.2), Right (0.1), Down (0.0), Left (0.1)
* s2: Up (1.1), Right (0.2), Down (0.1), Left (2.4)
* s3: Up (0.0), Right (3.3), Down (0.9), Left (0.1)
* s4: Up (1.8), Right (0.7), Down (0.3), Left (0.9)
### Key Observations
* The image presents a hierarchy of behavioral models, starting from simple reactive behavior to more complex intentional behavior.
* Each model is associated with a mathematical equation that captures the underlying principle.
* The Q-learning example provides a concrete illustration of reactive behavior.
* The equations for KL control and expected free energy provide a more detailed mathematical formulation of the models.
### Interpretation
The image provides a conceptual framework for understanding different types of behavior. The models are presented in increasing order of complexity, reflecting the increasing role of internal representations and goals in shaping behavior. The mathematical equations provide a formal language for describing these models, while the Q-learning example provides a concrete illustration of how reactive behavior can be implemented. The KL control and expected free energy equations suggest a deeper connection between these behavioral models and concepts from information theory and decision theory. The image suggests that behavior can be understood as a process of inference and decision-making, where agents use their internal models of the world to select actions that maximize their expected reward or minimize their expected cost.