## Line Chart: Continual Train
### Overview
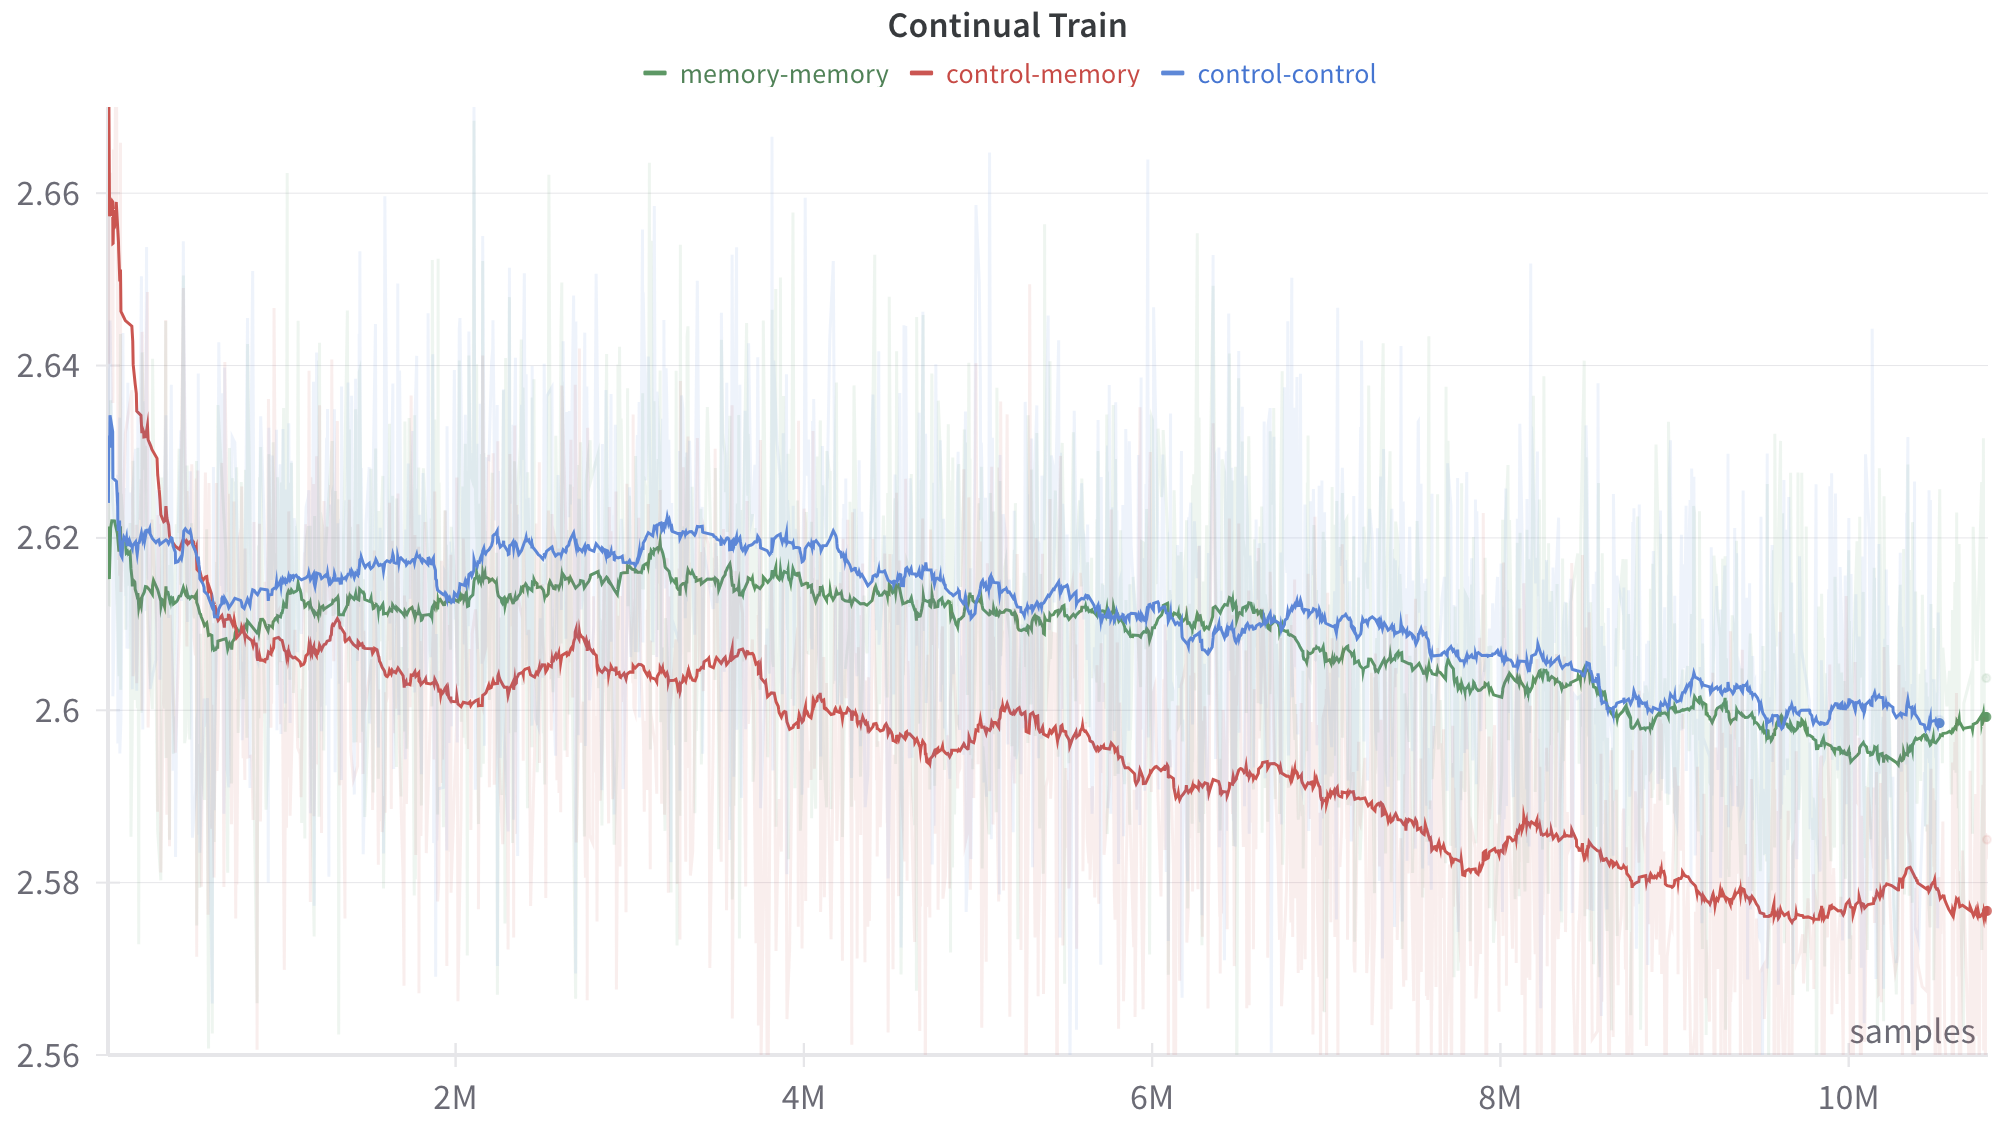
The image is a line chart titled "Continual Train" that compares three different training configurations: "memory-memory" (green), "control-memory" (red), and "control-control" (blue). The chart displays the performance of these configurations over a range of samples, from 0 to 10 million. The y-axis represents an unspecified metric, ranging from 2.56 to 2.66. The background contains faint vertical lines, possibly representing individual data points or iterations.
### Components/Axes
* **Title:** Continual Train
* **X-axis:** samples (labeled at the bottom-right corner)
* Scale: 0 to 10M, with major ticks at 2M intervals (2M, 4M, 6M, 8M, 10M).
* **Y-axis:** No explicit label.
* Scale: 2.56 to 2.66, with major ticks at 0.02 intervals (2.56, 2.58, 2.6, 2.62, 2.64, 2.66).
* **Legend:** Located at the top of the chart.
* memory-memory (green line)
* control-memory (red line)
* control-control (blue line)
### Detailed Analysis
* **memory-memory (green line):**
* Trend: Initially decreases, then stabilizes and slightly decreases again towards the end.
* Starting value: Approximately 2.62
* Value at 2M samples: Approximately 2.61
* Value at 4M samples: Approximately 2.615
* Value at 6M samples: Approximately 2.61
* Value at 8M samples: Approximately 2.60
* Value at 10M samples: Approximately 2.595
* **control-memory (red line):**
* Trend: Decreases significantly over the entire range.
* Starting value: Approximately 2.66
* Value at 2M samples: Approximately 2.60
* Value at 4M samples: Approximately 2.59
* Value at 6M samples: Approximately 2.59
* Value at 8M samples: Approximately 2.58
* Value at 10M samples: Approximately 2.575
* **control-control (blue line):**
* Trend: Decreases slightly, then stabilizes.
* Starting value: Approximately 2.62
* Value at 2M samples: Approximately 2.615
* Value at 4M samples: Approximately 2.62
* Value at 6M samples: Approximately 2.615
* Value at 8M samples: Approximately 2.61
* Value at 10M samples: Approximately 2.61
### Key Observations
* The "control-memory" configuration (red line) shows the most significant decrease in the metric over the training period.
* The "memory-memory" (green) and "control-control" (blue) configurations show a more stable performance, with a slight decrease over time.
* All three configurations appear to converge towards the end of the training period.
* The background noise (faint vertical lines) suggests high variability in the metric at each sample point.
### Interpretation
The chart compares the performance of three different training configurations for a "Continual Train" task. The "control-memory" configuration exhibits a clear downward trend, suggesting that it may be learning or adapting in a way that reduces the measured metric. The "memory-memory" and "control-control" configurations are more stable, indicating that they may be less sensitive to the training process or have already reached a stable performance level. The high variability in the background suggests that the training process is noisy, and the reported values are likely averages or smoothed representations of the underlying data. The y-axis label is missing, so the exact meaning of the metric is unknown, but the data suggests that minimizing this metric is the goal of the training process.