## Line Chart: Continual Train
### Overview
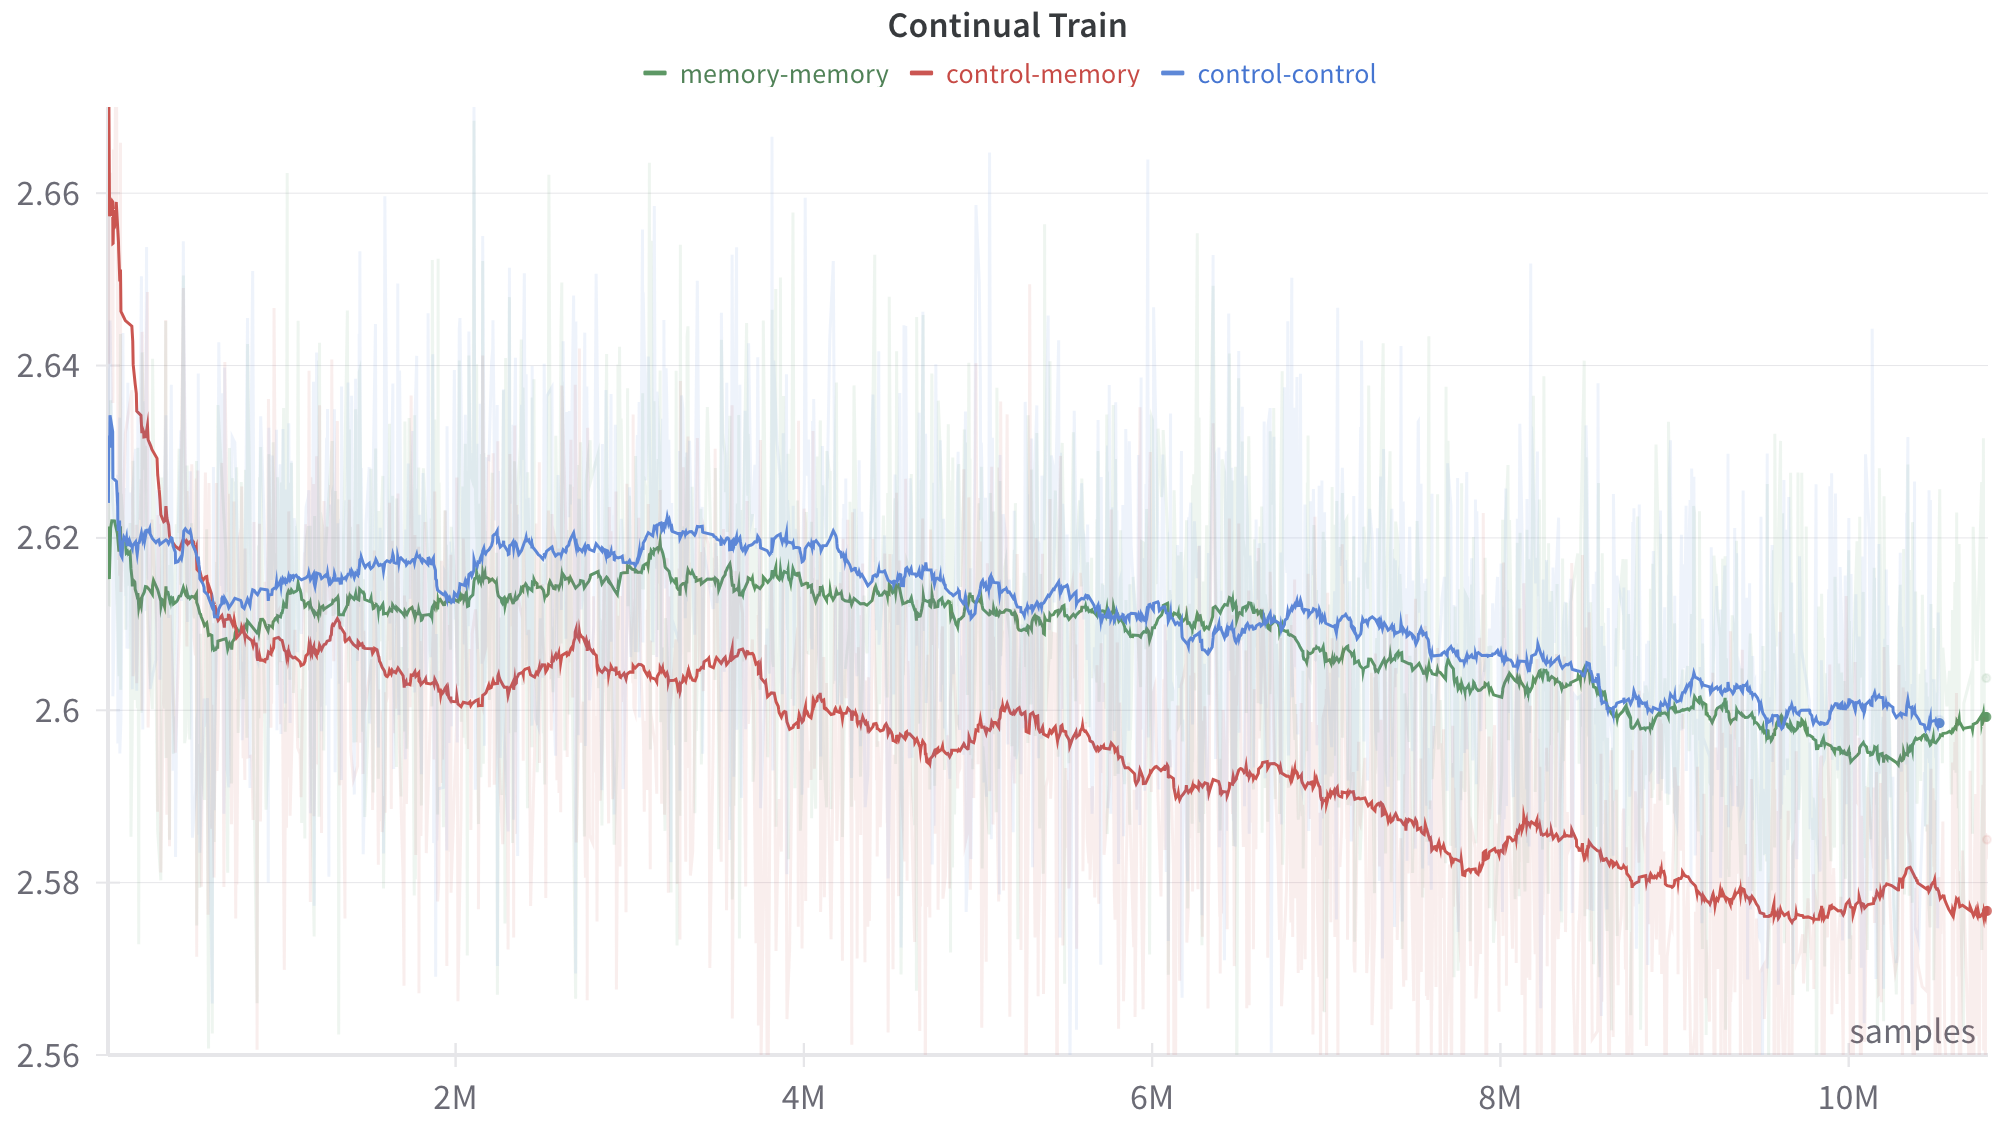
The image presents a line chart titled "Continual Train", depicting the performance of three different training configurations over a period of 10 million samples. The chart visualizes the loss function value for each configuration as a function of the number of samples processed. A shaded region represents the standard deviation around each line.
### Components/Axes
* **Title:** Continual Train
* **X-axis:** "samples" - ranging from 0 to 10M (10 million), with tick marks at 2M, 4M, 6M, 8M, and 10M.
* **Y-axis:** Loss value - ranging from 2.56 to 2.66, with tick marks at 2.58, 2.6, 2.62, 2.64, and 2.66.
* **Legend:** Located at the top-right corner of the chart.
* `memory-memory` (Green dashed line)
* `control-memory` (Red solid line)
* `control-control` (Blue solid line)
* **Shaded Region:** A light blue shaded region surrounds each line, representing the standard deviation.
### Detailed Analysis
The chart displays three lines representing the loss values for different training configurations.
* **memory-memory (Green dashed line):** The line starts at approximately 2.61 at 0 samples, initially decreases slightly, then fluctuates around 2.61-2.62 until 10M samples, ending at approximately 2.60. The line exhibits a generally stable trend with minor oscillations.
* **control-memory (Red solid line):** The line begins at approximately 2.61 at 0 samples, decreases to a minimum of around 2.57 at approximately 4M samples, then increases again, reaching approximately 2.59 at 10M samples. This line shows a more pronounced downward trend initially, followed by an upward trend.
* **control-control (Blue solid line):** The line starts at approximately 2.62 at 0 samples, fluctuates around 2.62-2.63, and gradually decreases to approximately 2.61 at 10M samples. The trend is relatively stable, with a slight downward slope.
Here's a more detailed breakdown of approximate values at key points:
| Samples (M) | memory-memory | control-memory | control-control |
|---|---|---|---|
| 0 | 2.61 | 2.61 | 2.62 |
| 2 | 2.61 | 2.59 | 2.62 |
| 4 | 2.61 | 2.57 | 2.62 |
| 6 | 2.61 | 2.58 | 2.61 |
| 8 | 2.60 | 2.59 | 2.61 |
| 10 | 2.60 | 2.59 | 2.61 |
### Key Observations
* The `control-memory` configuration exhibits the most significant change in loss value, with a noticeable decrease followed by an increase.
* The `memory-memory` configuration demonstrates the most stable loss value throughout the training process.
* The `control-control` configuration shows a gradual decrease in loss value.
* All three configurations converge towards similar loss values around 10M samples.
### Interpretation
The chart suggests that the `control-memory` configuration is more sensitive to the training process, experiencing both improvements and regressions in performance. The `memory-memory` configuration appears to be the most robust, maintaining a consistent level of performance. The `control-control` configuration provides a moderate level of performance, showing a gradual improvement over time.
The shaded regions indicate the variability in the loss values for each configuration. The width of the shaded regions suggests the degree of uncertainty or fluctuation in the training process. The convergence of the lines towards the end of the training period indicates that all configurations are approaching a similar level of performance, potentially suggesting that the training process is stabilizing.
The initial drop in loss for `control-memory` could indicate faster initial learning, but the subsequent increase suggests potential overfitting or instability. The consistent performance of `memory-memory` might indicate a more effective regularization strategy or a more stable learning process. The gradual improvement of `control-control` suggests a steady, but potentially slower, learning rate.