## Line Chart: Continual Train
### Overview
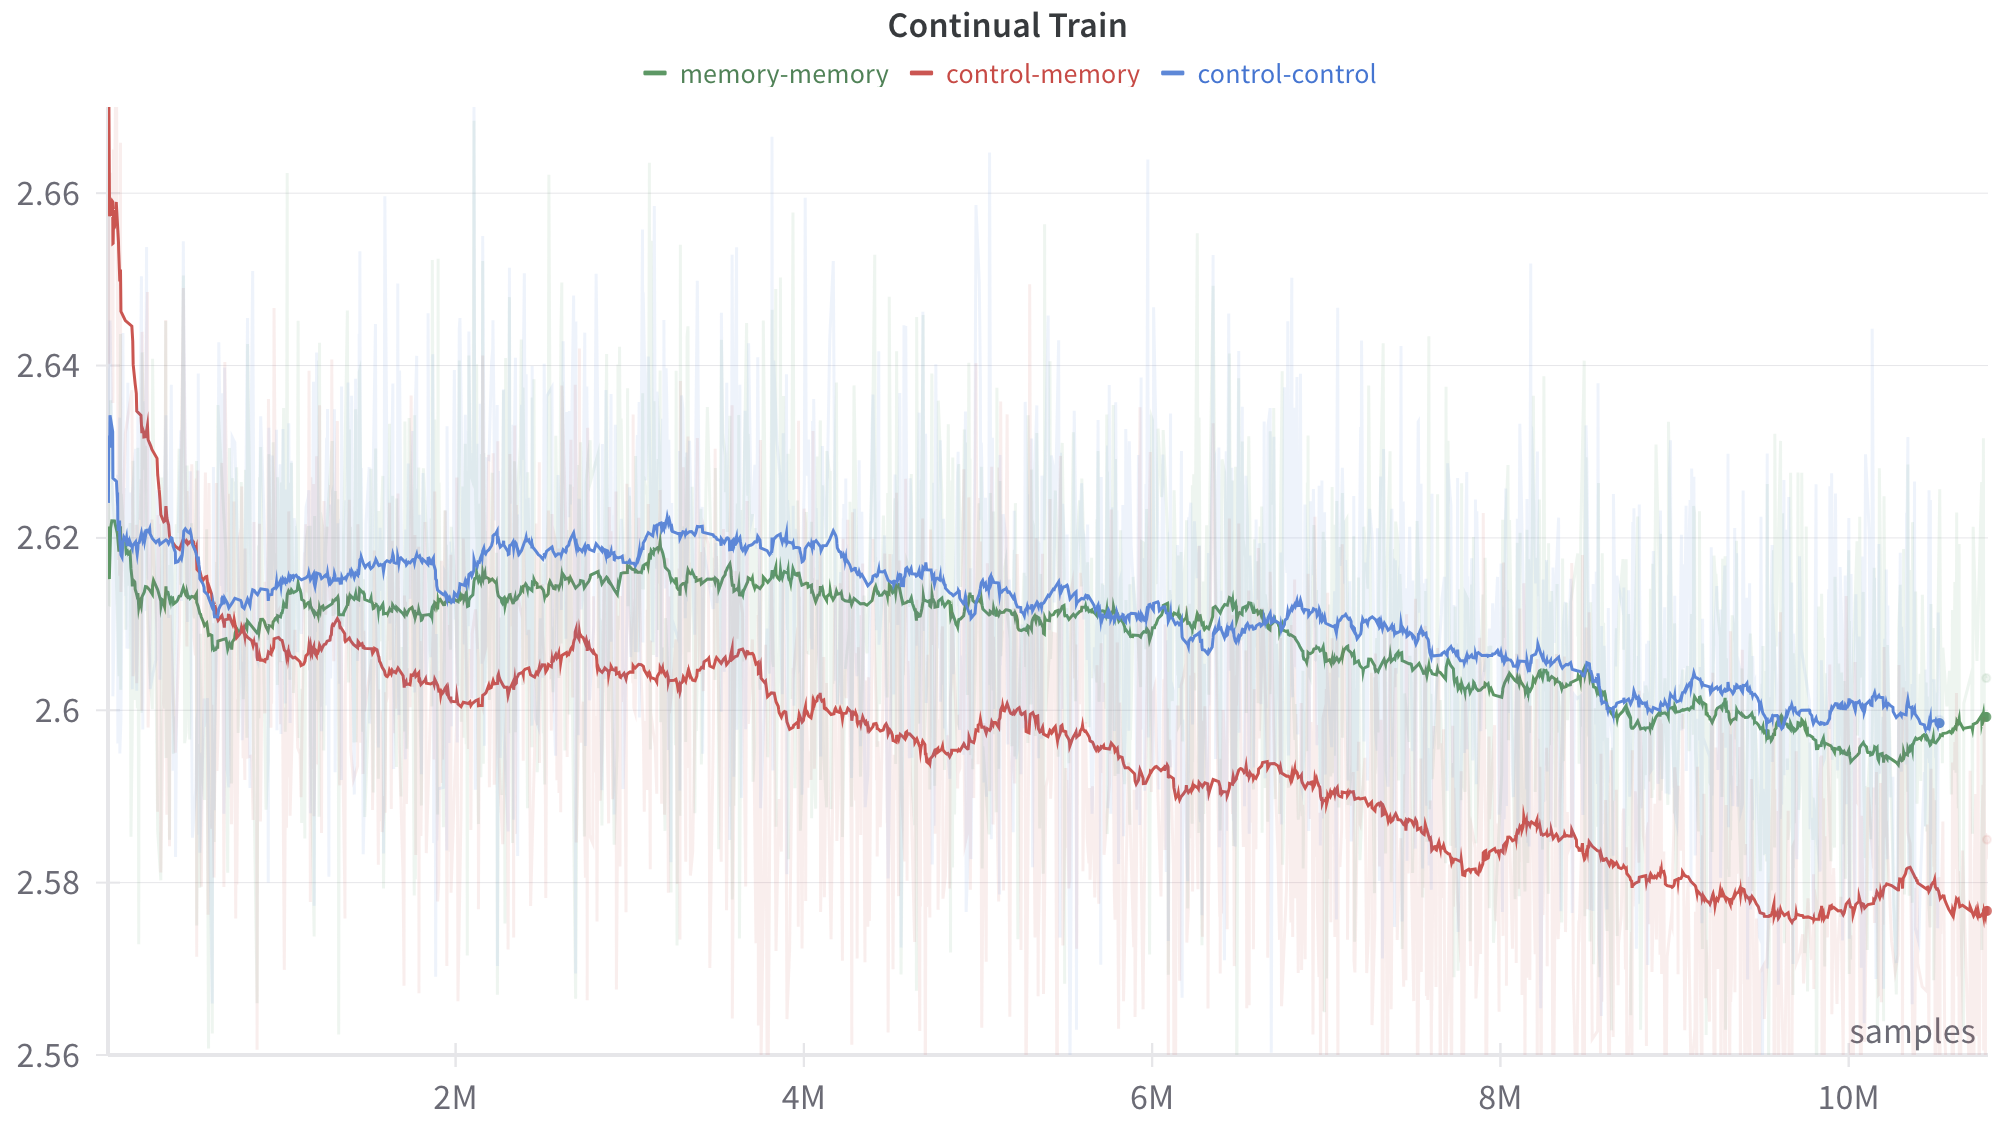
The image is a line chart titled "Continual Train" displaying three data series over a range of "samples" (x-axis) from 2M to 10M. The y-axis represents a numerical value between 2.56 and 2.66. The chart includes a legend with three colored lines: green (memory-memory), red (control-memory), and blue (control-control). The data shows trends in these series as the number of samples increases.
### Components/Axes
- **Title**: "Continual Train" (centered at the top).
- **Legend**:
- Green: memory-memory
- Red: control-memory
- Blue: control-control
- **X-axis**: Labeled "samples" with markers at 2M, 4M, 6M, 8M, and 10M.
- **Y-axis**: Labeled with numerical values from 2.56 to 2.66, with grid lines for reference.
- **Lines**: Three distinct lines (green, red, blue) plotted across the chart.
### Detailed Analysis
1. **Green Line (memory-memory)**:
- Starts near 2.62 at 2M.
- Dips slightly below 2.62 between 2M and 4M.
- Stabilizes around 2.61–2.62 from 4M to 10M.
- Shows minor fluctuations but remains relatively flat after 4M.
2. **Red Line (control-memory)**:
- Begins at 2.66 at 2M.
- Drops sharply to ~2.60 by 4M.
- Continues a gradual decline to ~2.58 by 10M.
- Exhibits more pronounced fluctuations compared to the green line.
3. **Blue Line (control-control)**:
- Starts near 2.62 at 2M.
- Fluctuates between 2.61–2.62 until 6M.
- Declines gradually to ~2.60 by 10M.
- Shows moderate variability but a consistent downward trend.
### Key Observations
- All three lines exhibit a general downward trend as the number of samples increases.
- The red line (control-memory) has the steepest initial decline, dropping from 2.66 to ~2.60 between 2M and 4M.
- The green line (memory-memory) stabilizes after an initial dip, showing minimal change after 4M.
- The blue line (control-control) has the most variability but a gradual decline over time.
### Interpretation
The data suggests that the performance or metric being measured (likely related to a machine learning or computational process) improves (lower values) as the number of samples increases. The **control-memory** (red) series shows the most significant improvement early on, while **memory-memory** (green) stabilizes, indicating it may be less sensitive to additional samples after a certain point. The **control-control** (blue) series demonstrates a moderate but consistent improvement, with fluctuations possibly reflecting variability in the training process. The chart highlights the importance of sample size in optimizing these metrics, with different components responding uniquely to increased data.