## Line Chart: Accuracy vs. Varying Maximum Depth
### Overview
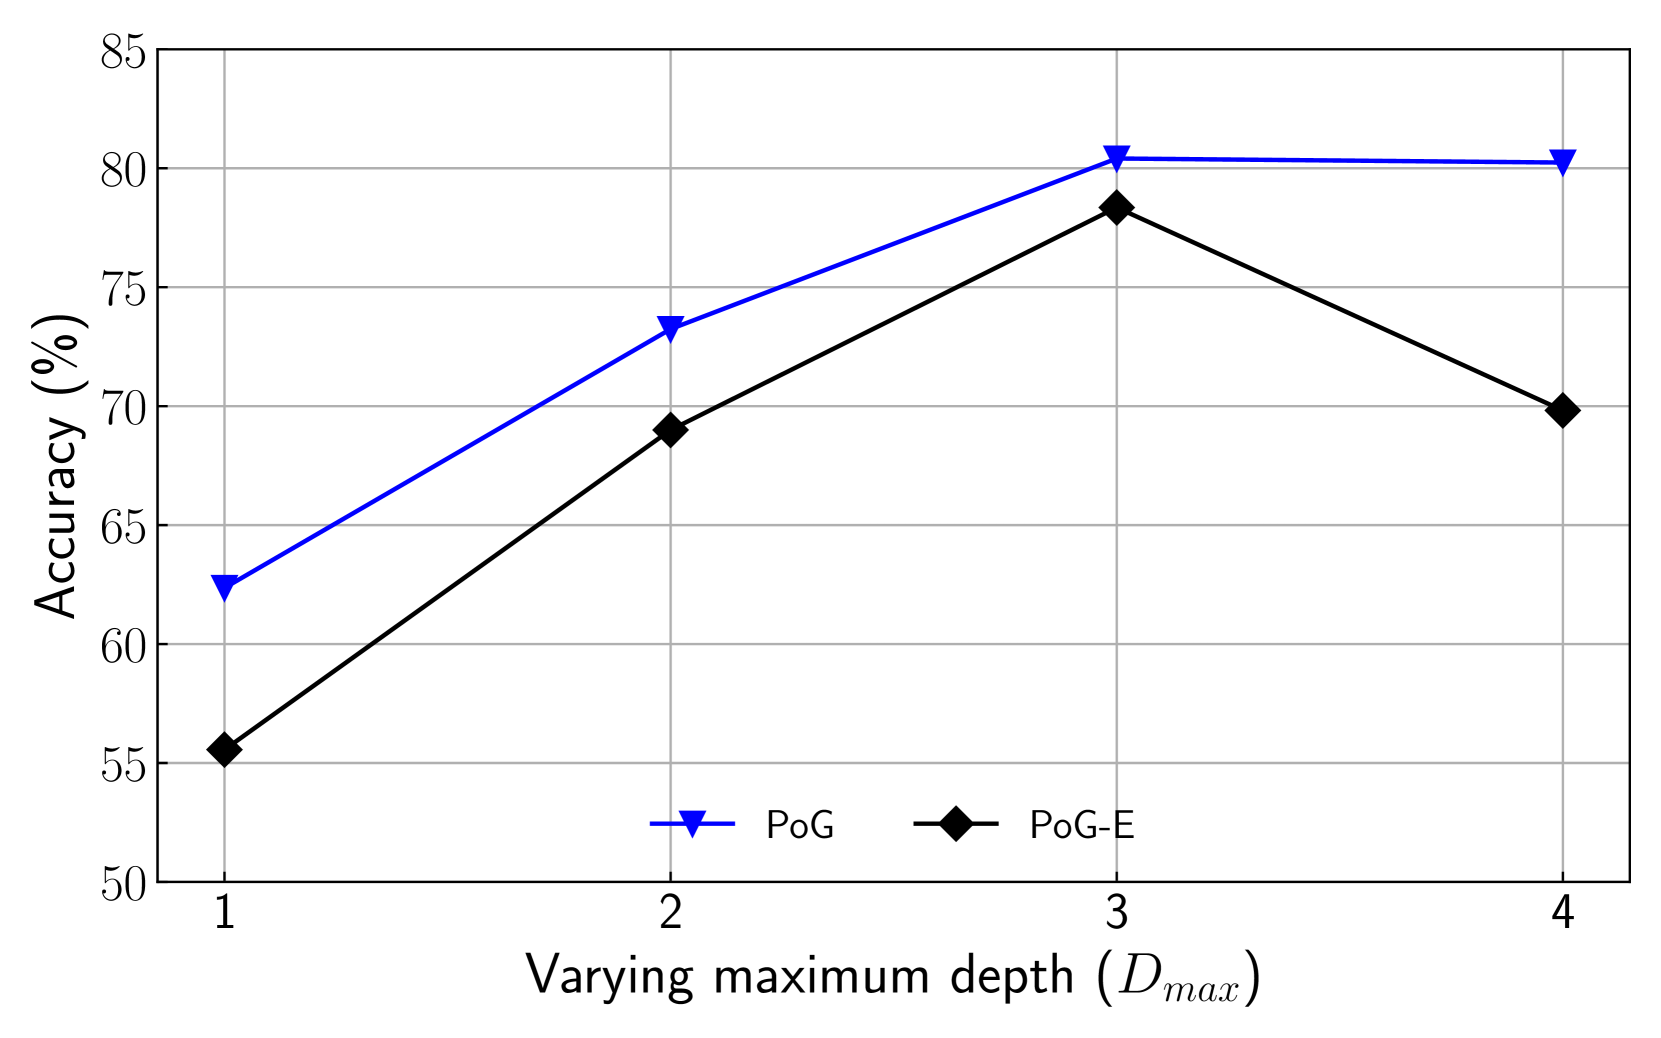
The image is a line chart comparing the accuracy of two models, PoG and PoG-E, across varying maximum depths (Dmax) from 1 to 4. The y-axis represents accuracy in percentage, ranging from 50% to 85%. The x-axis represents the varying maximum depth (Dmax).
### Components/Axes
* **X-axis:** Varying maximum depth (Dmax), with values 1, 2, 3, and 4.
* **Y-axis:** Accuracy (%), ranging from 50 to 85, with gridlines at intervals of 5.
* **Legend:** Located at the bottom of the chart.
* Blue line with downward-pointing triangle markers: PoG
* Black line with diamond markers: PoG-E
### Detailed Analysis
* **PoG (Blue Line):**
* Trend: The accuracy of PoG increases from Dmax = 1 to Dmax = 3, then plateaus.
* Data Points:
* Dmax = 1: Accuracy ≈ 62.5%
* Dmax = 2: Accuracy ≈ 73.5%
* Dmax = 3: Accuracy ≈ 80.5%
* Dmax = 4: Accuracy ≈ 80.5%
* **PoG-E (Black Line):**
* Trend: The accuracy of PoG-E increases from Dmax = 1 to Dmax = 3, then decreases.
* Data Points:
* Dmax = 1: Accuracy ≈ 55.5%
* Dmax = 2: Accuracy ≈ 69%
* Dmax = 3: Accuracy ≈ 78.5%
* Dmax = 4: Accuracy ≈ 70%
### Key Observations
* Both models show an increase in accuracy as the maximum depth increases from 1 to 3.
* PoG-E's accuracy decreases when the maximum depth is increased from 3 to 4, while PoG's accuracy remains relatively constant.
* PoG consistently outperforms PoG-E at all maximum depths.
### Interpretation
The chart suggests that increasing the maximum depth of the models initially improves their accuracy. However, for PoG-E, there is a point where increasing the depth further leads to a decrease in accuracy, possibly due to overfitting. PoG appears to be more stable at higher depths, maintaining its accuracy. The data indicates that PoG is the superior model across the tested range of maximum depths. The optimal depth for PoG-E appears to be around 3, while PoG performs well at both 3 and 4.