\n
## Line Chart: Accuracy vs. Maximum Depth
### Overview
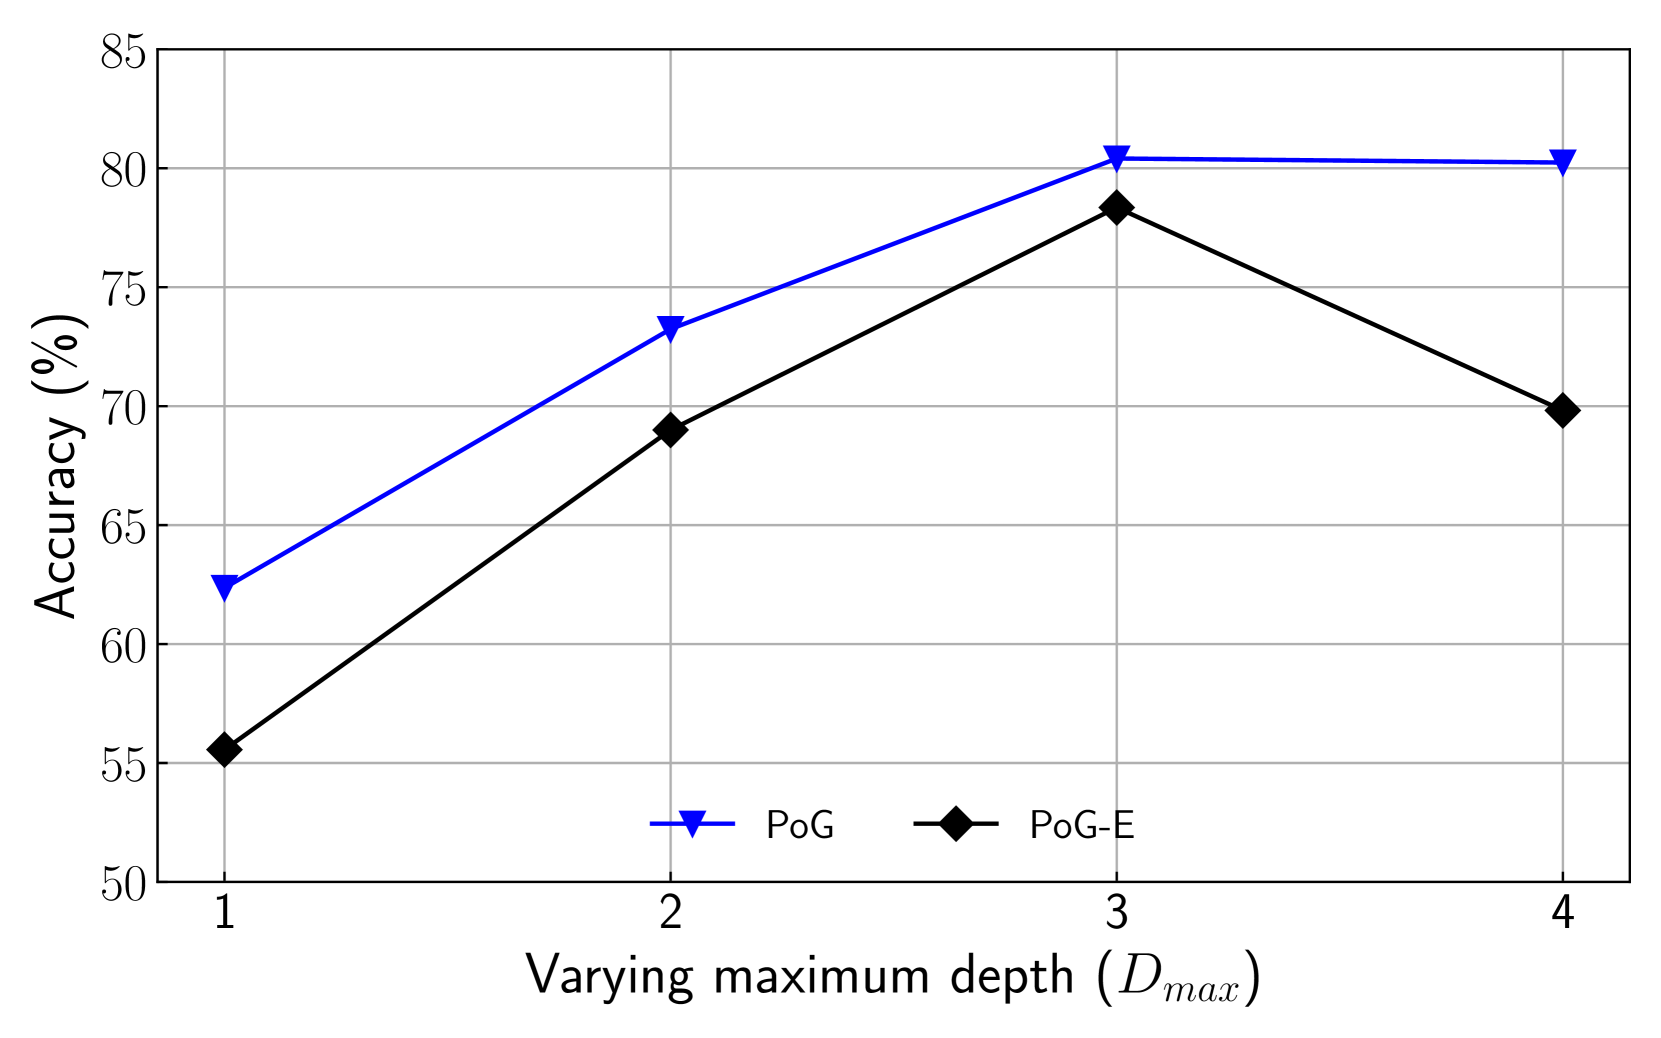
This line chart depicts the relationship between accuracy (in percentage) and varying maximum depth (D<sub>max</sub>) for two different methods: PoG and PoG-E. The chart shows how the accuracy of each method changes as the maximum depth increases from 1 to 4.
### Components/Axes
* **X-axis:** "Varying maximum depth (D<sub>max</sub>)" with markers at 1, 2, 3, and 4.
* **Y-axis:** "Accuracy (%)" with a scale ranging from 50% to 85%.
* **Legend:** Located at the top-center of the chart.
* **PoG:** Represented by a blue line with downward-pointing triangle markers.
* **PoG-E:** Represented by a black line with diamond markers.
* **Gridlines:** Horizontal and vertical gridlines are present to aid in reading values.
### Detailed Analysis
**PoG (Blue Line):**
The PoG line starts at approximately 63% accuracy at D<sub>max</sub> = 1. It then slopes upward, reaching approximately 73% at D<sub>max</sub> = 2, approximately 80% at D<sub>max</sub> = 3, and plateaus at approximately 80% for D<sub>max</sub> = 4.
* D<sub>max</sub> = 1: Accuracy ≈ 63%
* D<sub>max</sub> = 2: Accuracy ≈ 73%
* D<sub>max</sub> = 3: Accuracy ≈ 80%
* D<sub>max</sub> = 4: Accuracy ≈ 80%
**PoG-E (Black Line):**
The PoG-E line begins at approximately 55% accuracy at D<sub>max</sub> = 1. It increases sharply to approximately 70% at D<sub>max</sub> = 2, continues to rise to approximately 80% at D<sub>max</sub> = 3, and then decreases to approximately 70% at D<sub>max</sub> = 4.
* D<sub>max</sub> = 1: Accuracy ≈ 55%
* D<sub>max</sub> = 2: Accuracy ≈ 70%
* D<sub>max</sub> = 3: Accuracy ≈ 80%
* D<sub>max</sub> = 4: Accuracy ≈ 70%
### Key Observations
* PoG-E starts with lower accuracy than PoG at D<sub>max</sub> = 1.
* Both methods show increasing accuracy as D<sub>max</sub> increases from 1 to 3.
* PoG reaches a plateau in accuracy at D<sub>max</sub> = 3, while PoG-E's accuracy decreases at D<sub>max</sub> = 4.
* At D<sub>max</sub> = 3, both methods achieve the same accuracy of approximately 80%.
### Interpretation
The data suggests that increasing the maximum depth (D<sub>max</sub>) generally improves the accuracy of both PoG and PoG-E methods, up to a certain point. PoG appears to be less sensitive to further increases in depth beyond D<sub>max</sub> = 3, maintaining a consistent accuracy. PoG-E, however, experiences a decline in accuracy at D<sub>max</sub> = 4, indicating that exceeding a certain depth may introduce errors or inefficiencies for this method.
The plateauing of PoG suggests that the benefits of increasing depth diminish after a certain point, potentially due to limitations in the algorithm or the data itself. The decrease in PoG-E's accuracy at D<sub>max</sub> = 4 could be due to overfitting or increased computational complexity leading to errors.
The initial lower accuracy of PoG-E compared to PoG indicates that PoG-E may require a larger depth to achieve comparable performance. The convergence of the two methods at D<sub>max</sub> = 3 suggests that both methods can achieve similar levels of accuracy with appropriate parameter tuning.