## Line Chart: Run Family (Loops) Accuracy vs. Training Steps
### Overview
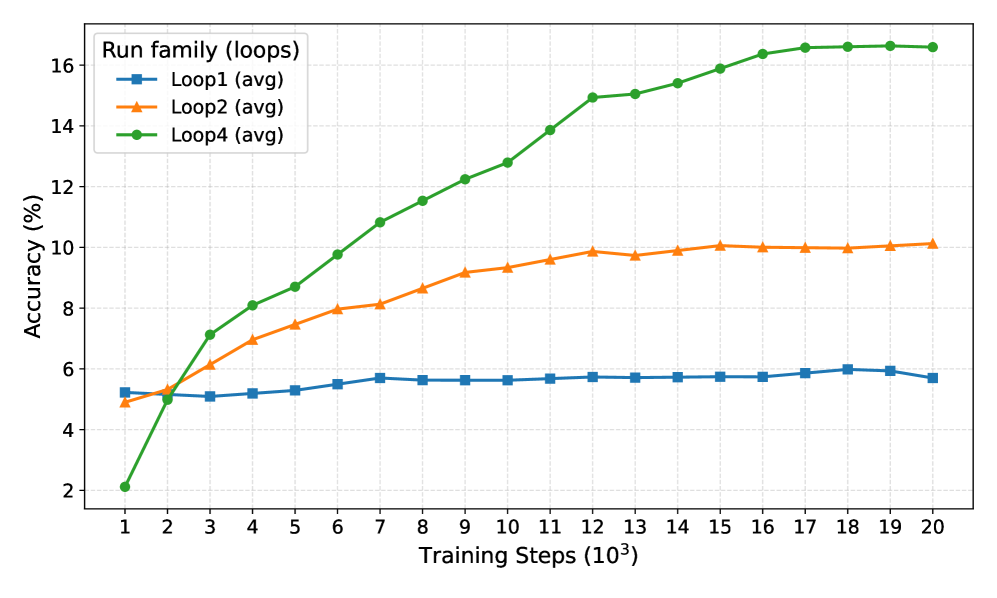
The image is a line chart comparing the accuracy of three different loop configurations (Loop1, Loop2, and Loop4) as a function of training steps. The x-axis represents training steps in thousands, ranging from 1 to 20. The y-axis represents accuracy in percentage, ranging from 2% to 16%.
### Components/Axes
* **Title:** Run family (loops)
* **X-axis:** Training Steps (10^3), with markers at each integer value from 1 to 20.
* **Y-axis:** Accuracy (%), with markers at each even integer value from 2 to 16.
* **Legend:** Located in the top-left corner of the chart.
* **Loop1 (avg):** Represented by a blue line with square markers.
* **Loop2 (avg):** Represented by an orange line with triangle markers.
* **Loop4 (avg):** Represented by a green line with circle markers.
### Detailed Analysis
* **Loop1 (avg) - Blue Line:**
* Trend: Relatively flat, showing minimal change in accuracy across training steps.
* Data Points: Starts at approximately 5.2% accuracy at 1000 training steps, fluctuates slightly, and ends at approximately 5.8% accuracy at 20,000 training steps.
* **Loop2 (avg) - Orange Line:**
* Trend: Increases initially, then plateaus.
* Data Points: Starts at approximately 5.0% accuracy at 1000 training steps, rises to approximately 10.0% accuracy around 14,000 training steps, and remains relatively stable thereafter.
* **Loop4 (avg) - Green Line:**
* Trend: Shows a significant increase in accuracy initially, then gradually plateaus.
* Data Points: Starts at approximately 2.0% accuracy at 1000 training steps, rises sharply to approximately 15.0% accuracy around 13,000 training steps, and then increases slowly to approximately 17.0% accuracy at 20,000 training steps.
### Key Observations
* Loop4 (green line) consistently outperforms Loop1 (blue line) and Loop2 (orange line) in terms of accuracy across all training steps.
* Loop1 (blue line) shows the least improvement in accuracy with increasing training steps.
* Loop2 (orange line) and Loop4 (green line) show significant initial gains in accuracy, but their improvement slows down as training progresses.
### Interpretation
The data suggests that Loop4 is the most effective loop configuration for this particular task, as it achieves the highest accuracy with increasing training steps. Loop1 appears to be the least effective, showing minimal improvement. Loop2 shows moderate improvement but plateaus earlier than Loop4. The initial rapid increase in accuracy for Loop2 and Loop4 indicates that these configurations benefit significantly from early training, while the later plateau suggests diminishing returns with further training. The stable performance of Loop1 suggests that it may be limited by some inherent factor that prevents it from improving with more training.