## Line Chart: Accuracy vs. Training Steps for Different Loop Families
### Overview
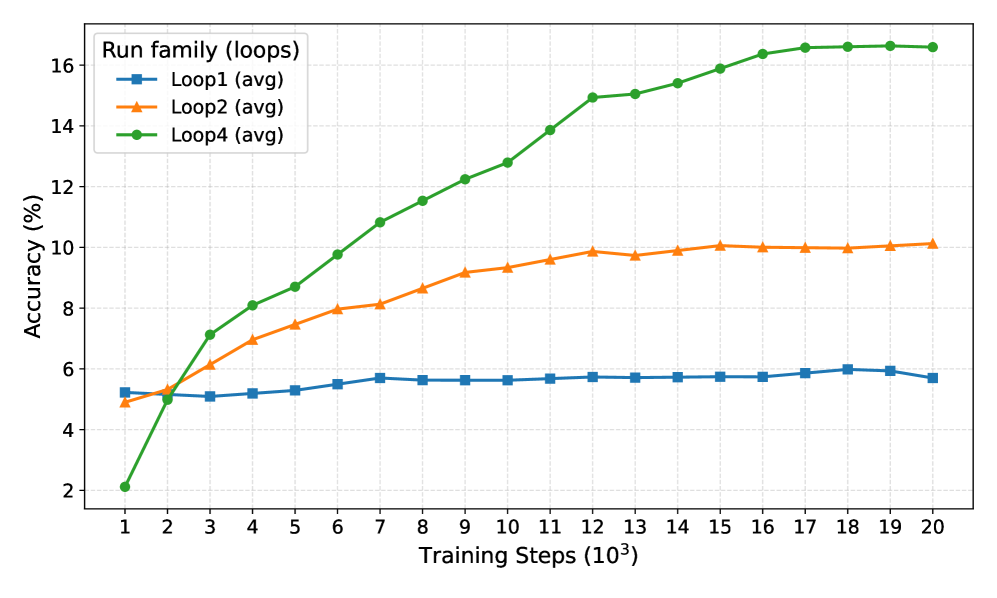
This line chart depicts the relationship between training steps and accuracy for three different loop families (Loop1, Loop2, and Loop4). The accuracy is measured in percentage, and the training steps are expressed in units of 10^3. The chart shows how the accuracy of each loop family changes as the training progresses.
### Components/Axes
* **X-axis:** Training Steps (10^3), ranging from 1 to 20.
* **Y-axis:** Accuracy (%), ranging from 2 to 16.
* **Legend:** Located in the top-right corner, identifies the three loop families:
* Loop1 (avg) - Blue line with square markers
* Loop2 (avg) - Orange line with circular markers
* Loop4 (avg) - Green line with triangular markers
### Detailed Analysis
**Loop1 (avg) - Blue Line:**
The blue line representing Loop1 shows a relatively flat trend, with a slight initial increase followed by stabilization.
* At Training Step 1: Approximately 5.1% accuracy.
* At Training Step 2: Approximately 5.2% accuracy.
* At Training Step 3: Approximately 5.4% accuracy.
* At Training Step 4: Approximately 5.6% accuracy.
* At Training Step 5: Approximately 5.7% accuracy.
* From Training Step 6 to 20: Accuracy remains relatively constant around 5.8% - 6.0%.
**Loop2 (avg) - Orange Line:**
The orange line representing Loop2 exhibits a more pronounced upward trend compared to Loop1, but plateaus earlier than Loop4.
* At Training Step 1: Approximately 5.1% accuracy.
* At Training Step 2: Approximately 5.2% accuracy.
* At Training Step 3: Approximately 6.5% accuracy.
* At Training Step 4: Approximately 7.8% accuracy.
* At Training Step 5: Approximately 8.5% accuracy.
* At Training Step 6: Approximately 9.0% accuracy.
* At Training Step 7: Approximately 9.3% accuracy.
* From Training Step 8 to 20: Accuracy stabilizes around 9.5% - 10.0%.
**Loop4 (avg) - Green Line:**
The green line representing Loop4 demonstrates the steepest and most consistent upward trend, achieving the highest accuracy values.
* At Training Step 1: Approximately 2.1% accuracy.
* At Training Step 2: Approximately 3.1% accuracy.
* At Training Step 3: Approximately 5.5% accuracy.
* At Training Step 4: Approximately 8.5% accuracy.
* At Training Step 5: Approximately 11.0% accuracy.
* At Training Step 6: Approximately 12.5% accuracy.
* At Training Step 7: Approximately 13.5% accuracy.
* At Training Step 8: Approximately 14.2% accuracy.
* At Training Step 9: Approximately 14.7% accuracy.
* At Training Step 10: Approximately 15.1% accuracy.
* From Training Step 11 to 20: Accuracy continues to increase, but at a slower rate, reaching approximately 16.0% by Training Step 20.
### Key Observations
* Loop4 consistently outperforms Loop1 and Loop2 in terms of accuracy.
* Loop1 exhibits the lowest accuracy and the flattest learning curve.
* Loop2 shows a moderate improvement in accuracy, but its learning curve plateaus earlier than Loop4.
* The initial accuracy of Loop4 is significantly lower than Loop1 and Loop2, but it quickly catches up and surpasses them.
### Interpretation
The data suggests that Loop4 is the most effective loop family for achieving high accuracy, given sufficient training steps. The initial lower accuracy of Loop4 might be due to a slower start or a more complex initialization process, but its superior learning rate ultimately leads to better performance. Loop1 appears to be the least effective, potentially indicating a suboptimal algorithm or configuration. Loop2 offers a compromise between initial performance and overall accuracy. The plateauing of Loop2 and Loop4's learning curves after a certain number of training steps suggests that further training might yield diminishing returns. This chart is valuable for comparing the performance of different loop families and identifying the most promising approach for maximizing accuracy. The differences in the learning curves could be due to variations in the underlying algorithms, hyperparameters, or data processing techniques used in each loop family.