## Bar Chart: Relative Attention Share by Model Layer
### Overview
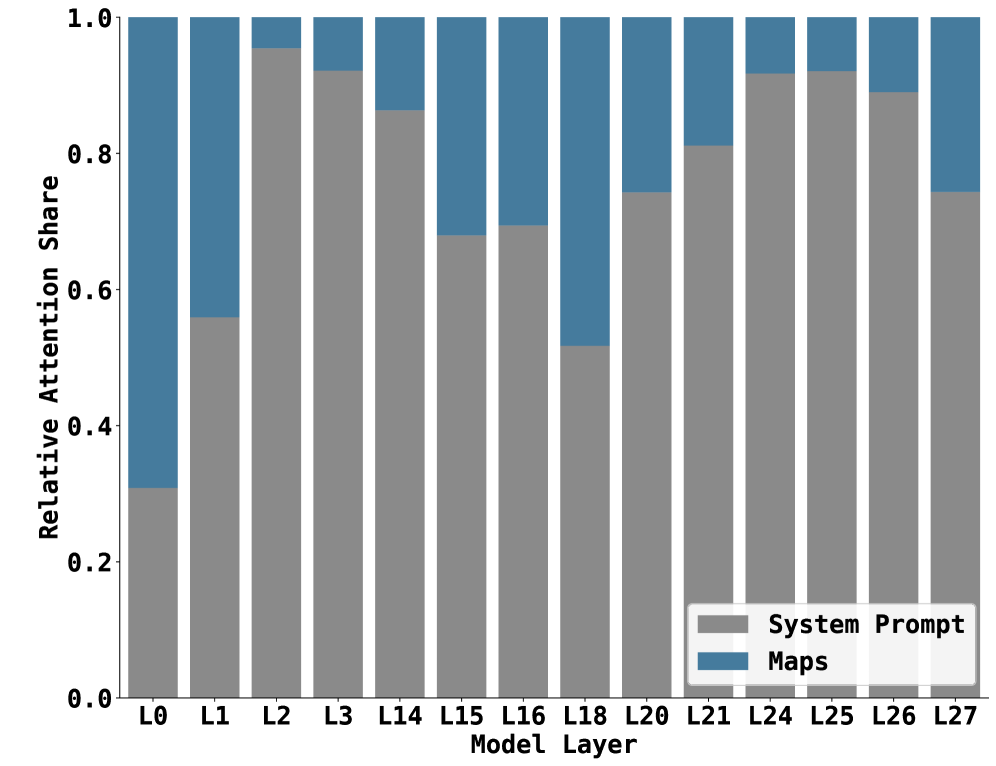
The image is a bar chart showing the relative attention share of "System Prompt" and "Maps" across different model layers (L0 to L27). The y-axis represents the relative attention share, ranging from 0.0 to 1.0. The x-axis represents the model layer. Each bar is divided into two colored sections: gray for "System Prompt" and blue for "Maps," indicating the proportion of attention each receives at that layer.
### Components/Axes
* **Y-axis:** "Relative Attention Share," ranging from 0.0 to 1.0 in increments of 0.2.
* **X-axis:** "Model Layer," with labels L0, L1, L2, L3, L14, L15, L16, L18, L20, L21, L24, L25, L26, L27.
* **Legend:** Located in the bottom-right corner, indicating gray for "System Prompt" and blue for "Maps."
### Detailed Analysis
Here's a breakdown of the attention share for each layer:
* **L0:** System Prompt ~0.3, Maps ~0.7
* **L1:** System Prompt ~0.56, Maps ~0.44
* **L2:** System Prompt ~0.95, Maps ~0.05
* **L3:** System Prompt ~0.92, Maps ~0.08
* **L14:** System Prompt ~0.87, Maps ~0.13
* **L15:** System Prompt ~0.68, Maps ~0.32
* **L16:** System Prompt ~0.7, Maps ~0.3
* **L18:** System Prompt ~0.52, Maps ~0.48
* **L20:** System Prompt ~0.74, Maps ~0.26
* **L21:** System Prompt ~0.81, Maps ~0.19
* **L24:** System Prompt ~0.92, Maps ~0.08
* **L25:** System Prompt ~0.92, Maps ~0.08
* **L26:** System Prompt ~0.9, Maps ~0.1
* **L27:** System Prompt ~0.74, Maps ~0.26
**Trends:**
* The "System Prompt" attention share generally increases from L0 to L2, then remains high with some fluctuations.
* The "Maps" attention share is highest at L0 and L1, then decreases significantly and remains low for most of the later layers.
### Key Observations
* Layers L2, L3, L14, L24, and L25 show the highest attention share for the "System Prompt."
* Layer L0 shows the highest attention share for "Maps."
* There is a significant shift in attention from "Maps" to "System Prompt" between layers L1 and L2.
### Interpretation
The chart suggests that the model initially relies heavily on "Maps" (as seen in L0 and L1), but as the processing goes deeper into the network (from L2 onwards), the "System Prompt" becomes the dominant focus. This could indicate that the initial layers are involved in processing and understanding the map data, while later layers focus more on the instructions or context provided by the system prompt to generate the final output. The fluctuations in later layers might reflect specific interactions or dependencies between the prompt and the map data at different stages of processing.