\n
## Stacked Bar Chart: Relative Attention Share by Model Layer
### Overview
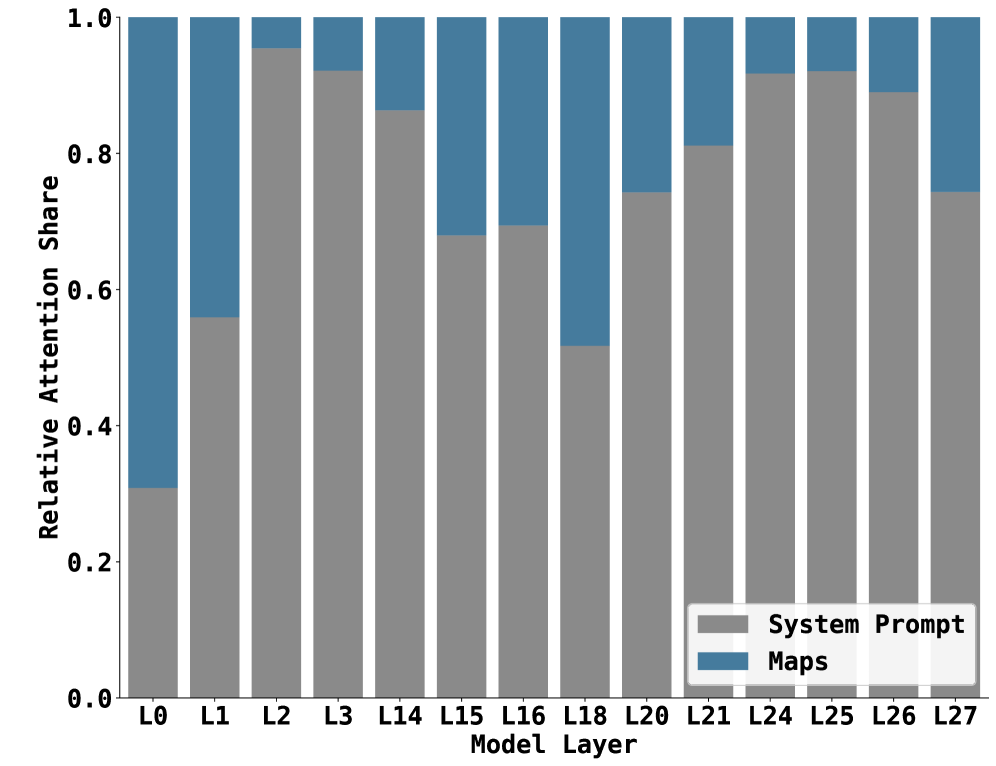
This image is a stacked bar chart visualizing the distribution of "Relative Attention Share" between two categories, "System Prompt" and "Maps," across a series of discrete model layers. The chart aims to show how the allocation of attention changes at different depths within a model architecture.
### Components/Axes
* **Chart Type:** Stacked Bar Chart.
* **X-Axis (Horizontal):** Labeled "Model Layer". It displays categorical labels for specific layers: L0, L1, L2, L3, L14, L15, L16, L18, L20, L21, L24, L25, L26, L27. The layers are not presented in strict numerical sequence.
* **Y-Axis (Vertical):** Labeled "Relative Attention Share". It is a linear scale ranging from 0.0 to 1.0, with major tick marks at 0.0, 0.2, 0.4, 0.6, 0.8, and 1.0.
* **Legend:** Located in the bottom-right corner of the chart area. It defines the two data series:
* A gray square labeled "System Prompt".
* A blue square labeled "Maps".
* **Data Series:** Each bar represents a model layer and is divided into two colored segments whose heights sum to 1.0 (the total relative attention share for that layer).
### Detailed Analysis
The following table reconstructs the approximate data from the chart. Values are estimated based on visual alignment with the y-axis grid. The "System Prompt" (gray) segment is always the bottom portion of the bar.
| Model Layer | System Prompt (Gray) Share (Approx.) | Maps (Blue) Share (Approx.) | Visual Trend Description |
| :--- | :--- | :--- | :--- |
| **L0** | 0.30 | 0.70 | Maps dominates; the blue segment is more than twice the height of the gray. |
| **L1** | 0.56 | 0.44 | System Prompt becomes the majority share. |
| **L2** | 0.95 | 0.05 | System Prompt overwhelmingly dominates; the Maps segment is a very thin sliver. |
| **L3** | 0.92 | 0.08 | System Prompt remains dominant. |
| **L14** | 0.86 | 0.14 | System Prompt share decreases slightly from L3 but remains high. |
| **L15** | 0.68 | 0.32 | Notable increase in Maps share compared to previous layers. |
| **L16** | 0.70 | 0.30 | Similar distribution to L15. |
| **L18** | 0.52 | 0.48 | Nearly equal split; this is the only layer besides L0 where Maps approaches or exceeds half the share. |
| **L20** | 0.74 | 0.26 | System Prompt share increases again. |
| **L21** | 0.81 | 0.19 | System Prompt share continues to increase. |
| **L24** | 0.92 | 0.08 | System Prompt share returns to a very high level, similar to L3. |
| **L25** | 0.92 | 0.08 | Identical or near-identical distribution to L24. |
| **L26** | 0.89 | 0.11 | Slight decrease in System Prompt share from L25. |
| **L27** | 0.74 | 0.26 | System Prompt share decreases to a level similar to L20. |
### Key Observations
1. **Dominance of System Prompt:** In 12 out of the 14 layers shown, the "System Prompt" category holds the majority of the relative attention share (value > 0.5).
2. **Two Exceptional Layers:** Layer **L0** is the only layer where "Maps" has a clear majority (~0.70). Layer **L18** shows the most balanced distribution, with shares nearly equal (~0.52 vs. ~0.48).
3. **High-Attention Layers:** Layers **L2, L3, L24, and L25** show the highest concentration of attention on the System Prompt, with shares exceeding 0.90.
4. **Non-Sequential Layers:** The x-axis does not list layers in order (e.g., jumps from L3 to L14, includes L18 between L16 and L20). This suggests the chart may be highlighting specific layers of interest rather than a continuous sequence.
5. **Pattern of Fluctuation:** There is no simple linear trend. The System Prompt share spikes early (L2), dips in the middle layers (L15, L16, L18), rises again (L20-L25), and dips slightly at the end (L27).
### Interpretation
This chart provides a diagnostic view into the internal attention mechanisms of a model, likely a large language model (LLM) given the "System Prompt" label. The data suggests that the model's attention is not uniformly distributed.
* **Functional Specialization:** The stark contrast between L0 (Maps-heavy) and L2 (System Prompt-heavy) implies rapid specialization in the earliest layers. L0 may be processing raw input or spatial/metadata information ("Maps"), while subsequent layers quickly shift focus to the core instructions ("System Prompt").
* **Mid-Layer Re-engagement:** The increased share for "Maps" in layers L15, L16, and especially L18 indicates a potential phase where the model re-evaluates or integrates map-based information after having processed the system prompt extensively. This could be crucial for tasks requiring grounding in external data or spatial reasoning.
* **Late-Layer Consensus:** The return to high System Prompt attention in layers L24-L25 suggests a final consolidation or application of the core instructions before output generation.
* **Architectural Insight:** The non-sequential layer selection implies these specific layers are considered critical checkpoints for understanding how the model balances its foundational instructions against other input types. The visualization effectively argues that attention allocation is dynamic and layer-dependent, challenging a view of uniform processing depth.
**Language Note:** All text in the image is in English.