## Bar Chart: Relative Attention Share by Model Layer
### Overview
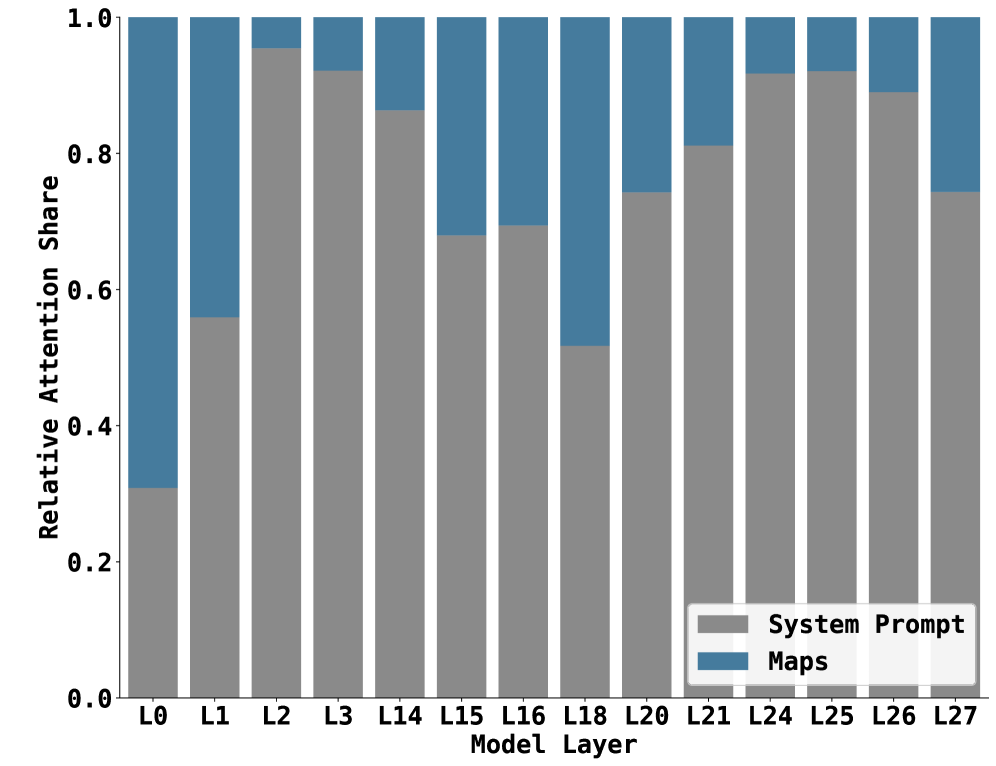
The chart visualizes the distribution of attention between two components ("System Prompt" and "Maps") across 28 model layers (L0 to L27). Each bar represents a layer, with stacked segments showing the relative contribution of each component to total attention.
### Components/Axes
- **X-axis**: Model Layers (L0 to L27, labeled sequentially)
- **Y-axis**: Relative Attention Share (0.0 to 1.0)
- **Legend**:
- Gray: System Prompt
- Blue: Maps
- **Bar Structure**: Stacked vertical bars (total height = 1.0 per layer)
### Detailed Analysis
| Layer | System Prompt (Gray) | Maps (Blue) | Notes |
|-------|----------------------|-------------|-------|
| L0 | ~0.3 | ~0.7 | Maps dominate early layers |
| L1 | ~0.4 | ~0.6 | Gradual shift toward System Prompt |
| L2 | ~0.95 | ~0.05 | System Prompt peaks |
| L3 | ~0.9 | ~0.1 | Sustained System Prompt focus |
| L14 | ~0.85 | ~0.15 | Stable System Prompt dominance |
| L15 | ~0.7 | ~0.3 | Maps regain partial attention |
| L16 | ~0.7 | ~0.3 | Similar to L15 |
| L18 | ~0.5 | ~0.5 | Balanced attention split |
| L20 | ~0.75 | ~0.25 | System Prompt resurgence |
| L21 | ~0.8 | ~0.2 | Continued System Prompt focus |
| L24 | ~0.9 | ~0.1 | Near-peak System Prompt |
| L25 | ~0.9 | ~0.1 | Matches L24 |
| L26 | ~0.85 | ~0.15 | Slight Maps rebound |
| L27 | ~0.75 | ~0.25 | Maps regain significant share |
### Key Observations
1. **Early Layers (L0-L3)**: Maps dominate attention (60-95% share), suggesting initial processing prioritizes mapping tasks.
2. **Mid-Layers (L14-L16)**: System Prompt maintains 70-85% share, indicating sustained focus on prompt-guided processing.
3. **Late Layers (L18-L27)**: Attention becomes more variable:
- L18 shows equal split (50-50)
- L24-L25 peak at 90% System Prompt
- L27 returns to 75% System Prompt / 25% Maps
4. **Non-linear Pattern**: No consistent monotonic trend; attention shifts cyclically between components.
### Interpretation
The data suggests a dynamic interplay between System Prompt and Maps attention across layers:
- **Early Processing (L0-L3)**: Maps likely handle spatial/geometric computations, while System Prompt begins integrating contextual instructions.
- **Mid-Processing (L14-L16)**: System Prompt dominates, possibly reflecting hierarchical decision-making or rule application.
- **Late Processing (L18-L27)**: The cyclical pattern may indicate iterative refinement, where Maps re-emerge for spatial adjustments after System Prompt establishes logical frameworks.
Notably, the 50-50 split at L18 could represent a critical decision point where both components equally influence outcomes. The final layers (L24-L27) show System Prompt maintaining >80% share despite Maps' resurgence, implying prompt-guided logic remains foundational even as spatial considerations re-emerge.