## Heatmap: Performance vs. Number of Feedback Repairs and Initial Programs
### Overview
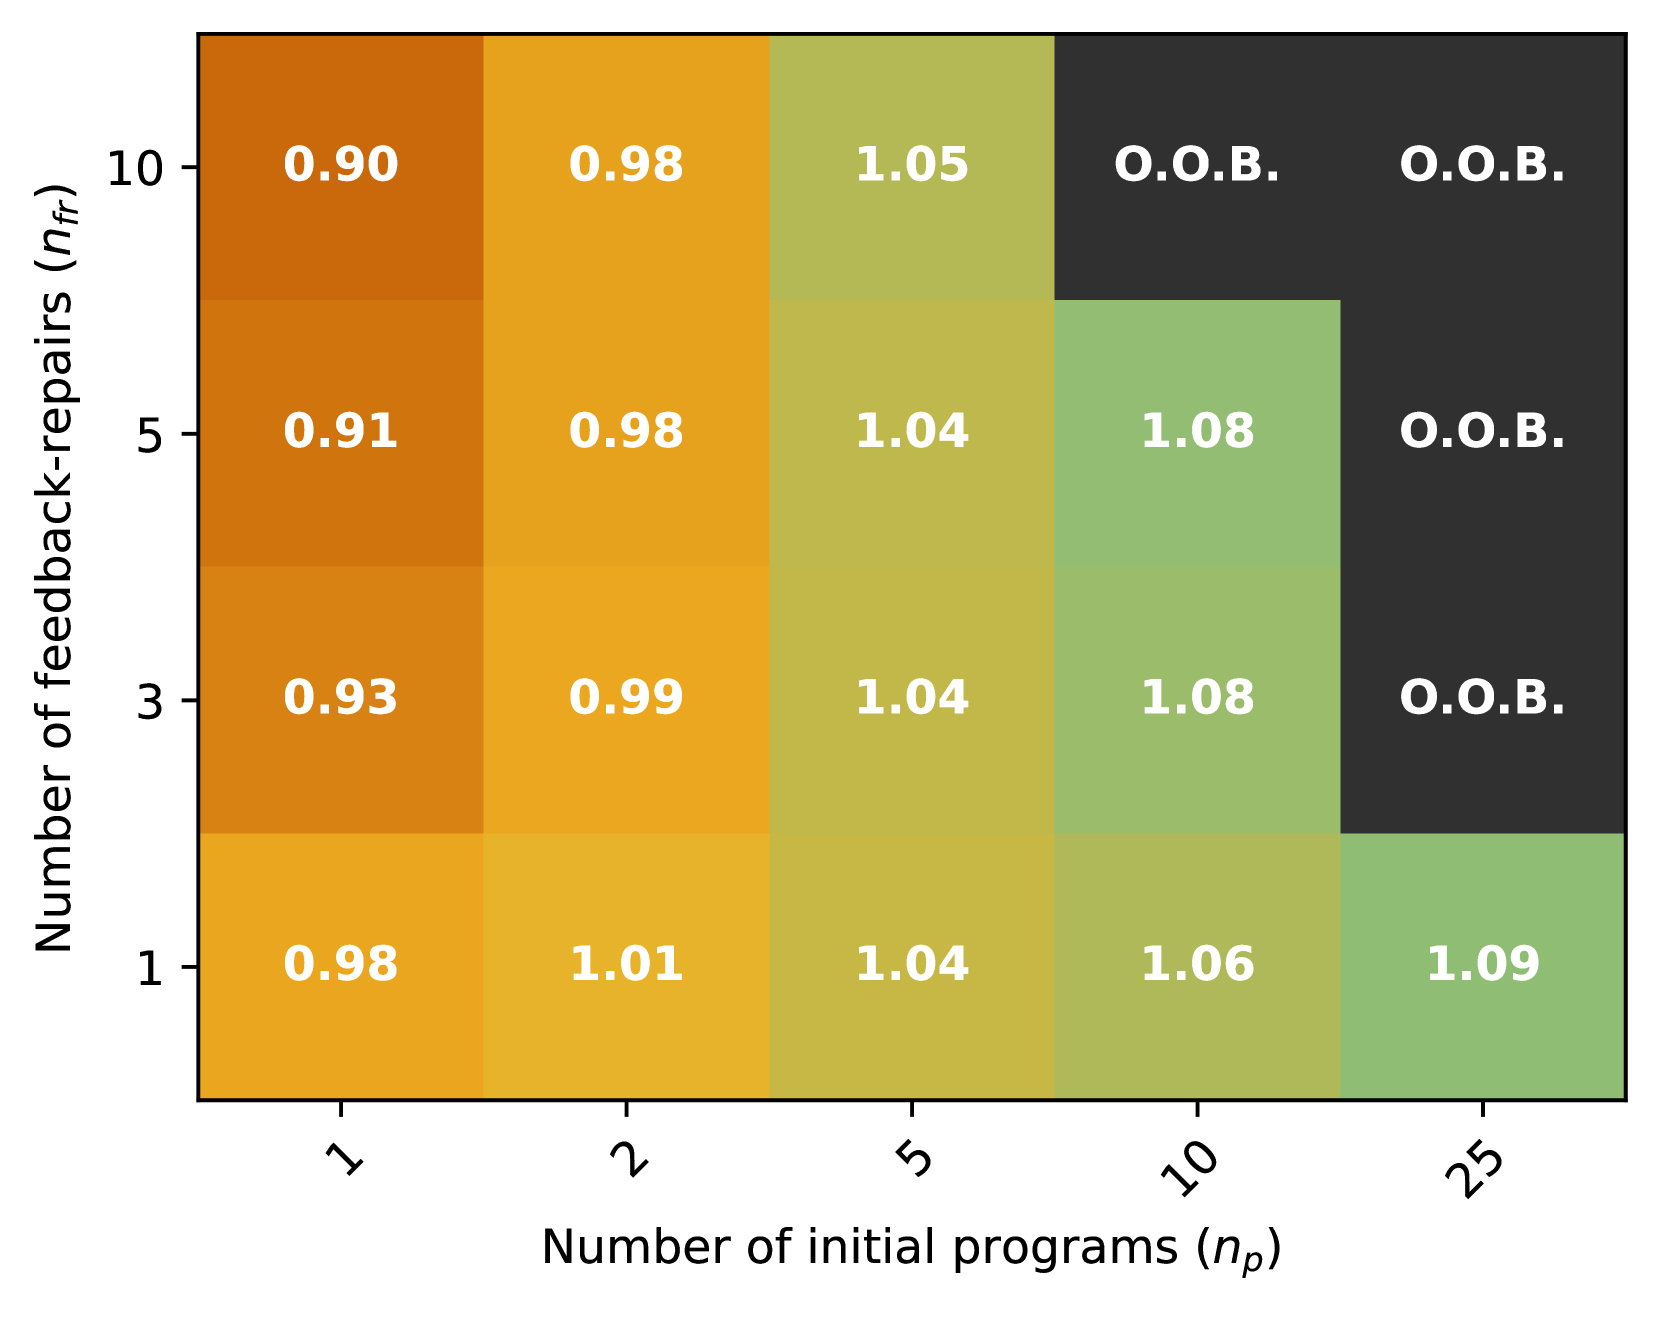
The image is a heatmap visualizing performance (represented by color intensity) as a function of two variables: the number of feedback repairs (nfr) and the number of initial programs (np). The heatmap displays numerical values within each cell, and some cells are marked "O.O.B." (likely indicating "Out Of Bounds").
### Components/Axes
* **X-axis (Horizontal):** Number of initial programs (np). Values: 1, 2, 5, 10, 25.
* **Y-axis (Vertical):** Number of feedback-repairs (nfr). Values: 1, 3, 5, 10.
* **Color Scale:** The color intensity represents performance. Darker orange indicates lower values, transitioning to lighter yellow and then green for higher values. Black indicates "O.O.B."
* **Cells:** Each cell contains a numerical value (performance) or the label "O.O.B.".
### Detailed Analysis or ### Content Details
Here's a breakdown of the values in the heatmap:
| nfr \ np | 1 | 2 | 5 | 10 | 25 |
| :------- | :--- | :--- | :--- | :--- | :--- |
| 10 | 0.90 | 0.98 | 1.05 | O.O.B. | O.O.B. |
| 5 | 0.91 | 0.98 | 1.04 | 1.08 | O.O.B. |
| 3 | 0.93 | 0.99 | 1.04 | 1.08 | O.O.B. |
| 1 | 0.98 | 1.01 | 1.04 | 1.06 | 1.09 |
**Observations:**
* **nfr = 10:** Performance starts at 0.90 for np = 1, increases to 0.98 for np = 2, then to 1.05 for np = 5. It is "O.O.B." for np = 10 and np = 25.
* **nfr = 5:** Performance starts at 0.91 for np = 1, increases to 0.98 for np = 2, then to 1.04 for np = 5, and 1.08 for np = 10. It is "O.O.B." for np = 25.
* **nfr = 3:** Performance starts at 0.93 for np = 1, increases to 0.99 for np = 2, then to 1.04 for np = 5, and 1.08 for np = 10. It is "O.O.B." for np = 25.
* **nfr = 1:** Performance starts at 0.98 for np = 1, increases to 1.01 for np = 2, then to 1.04 for np = 5, 1.06 for np = 10, and 1.09 for np = 25.
**Trends:**
* For a fixed number of feedback repairs (nfr), performance generally increases as the number of initial programs (np) increases, up to a point.
* For a fixed number of initial programs (np), performance generally decreases as the number of feedback repairs (nfr) increases.
* "O.O.B." (Out Of Bounds) occurs more frequently with higher numbers of feedback repairs (nfr) and initial programs (np).
### Key Observations
* The highest performance values (1.08 and 1.09) are observed when the number of feedback repairs is low (nfr = 1, 3, 5) and the number of initial programs is relatively high (np = 10, 25).
* The lowest performance values (0.90, 0.91, 0.93) are observed when the number of feedback repairs is high (nfr = 10, 5, 3) and the number of initial programs is low (np = 1).
* The "O.O.B." values suggest that certain combinations of feedback repairs and initial programs are not feasible or result in invalid outputs.
### Interpretation
The heatmap suggests that there is an optimal balance between the number of feedback repairs and the number of initial programs. Too many feedback repairs, especially with a small initial program pool, can lead to lower performance. Conversely, a small number of feedback repairs with a large initial program pool can yield the best performance. The "O.O.B." values indicate constraints or limitations in the system being modeled, where certain parameter combinations are not viable. The data suggests that increasing the number of initial programs generally improves performance, but this effect is limited by the number of feedback repairs. The system likely becomes unstable or encounters errors when both the number of feedback repairs and initial programs are too high.