## Heatmap: Feedback-Repairs vs. Initial Programs
### Overview
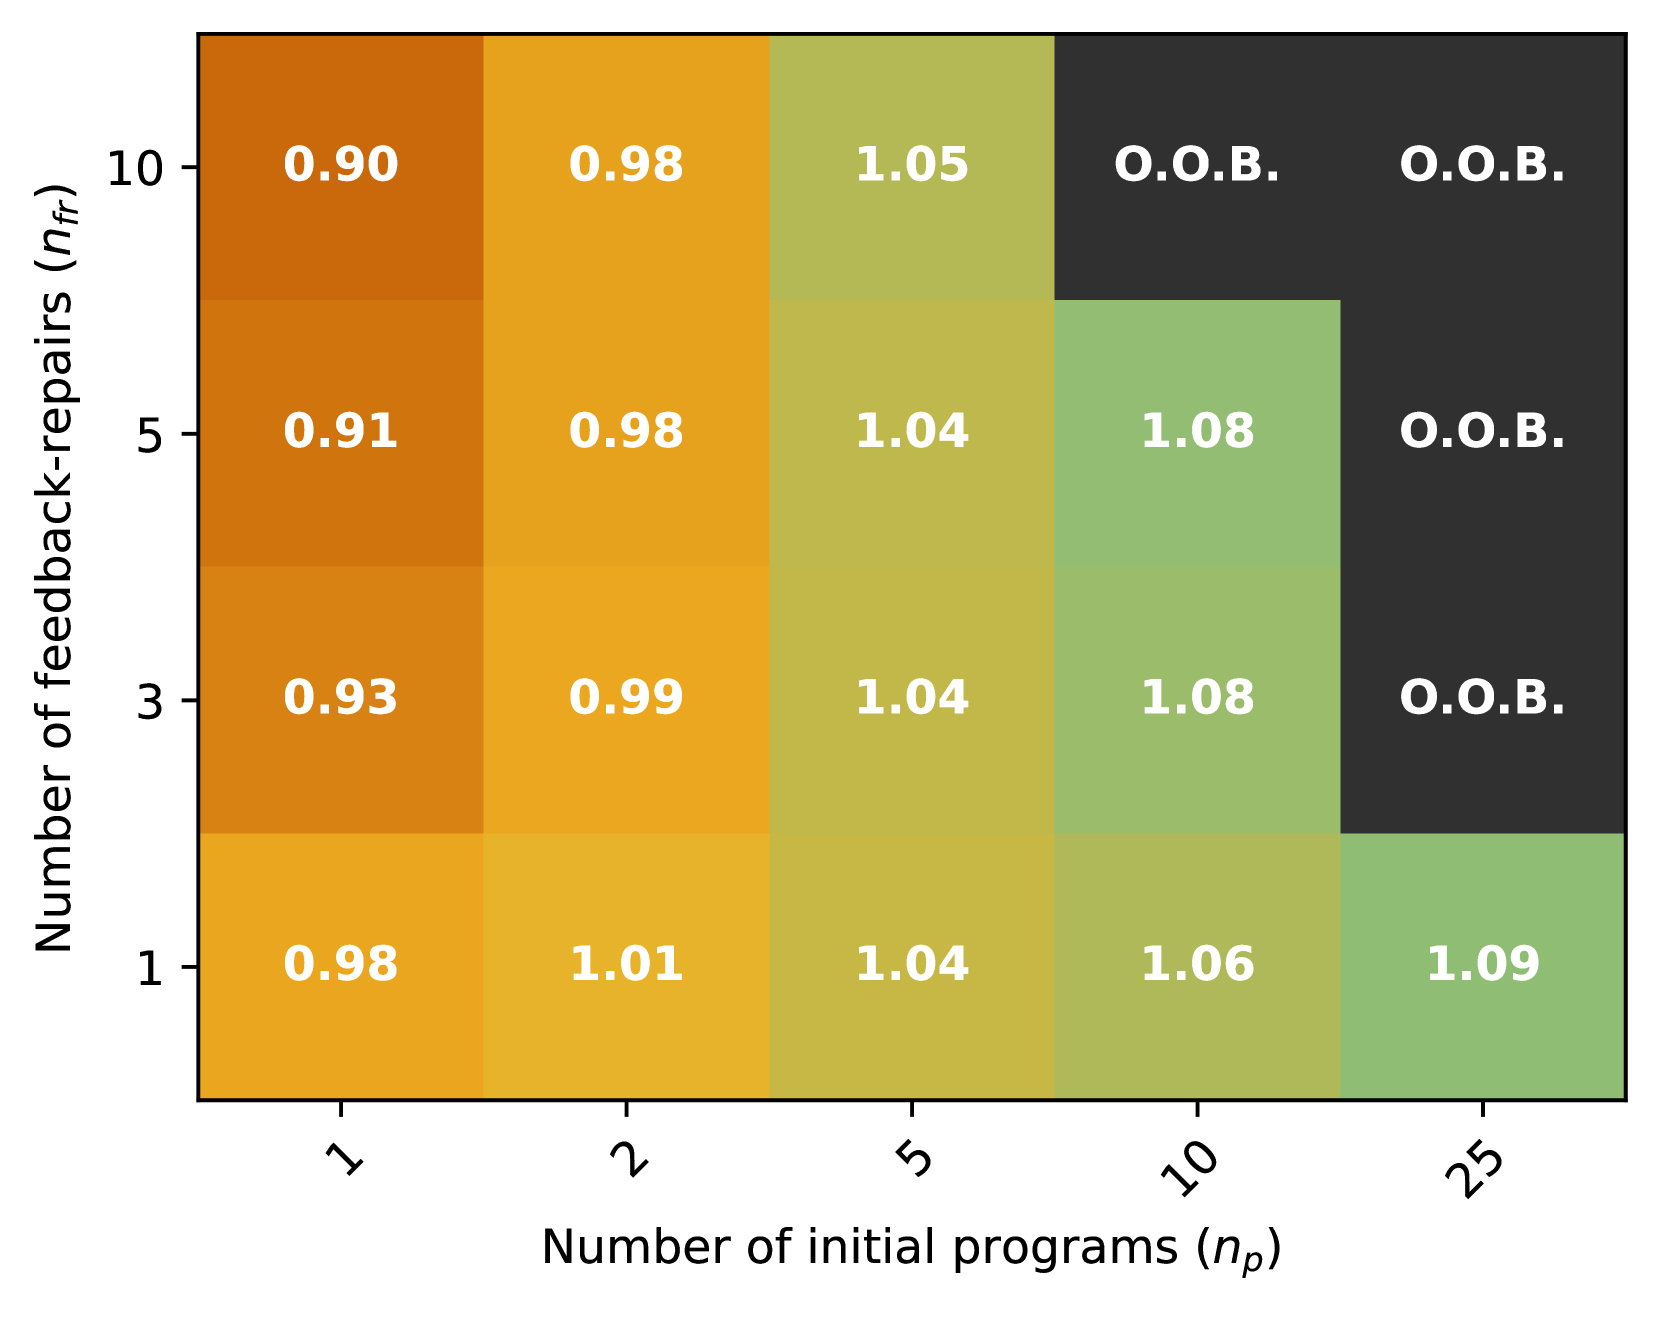
This image presents a heatmap visualizing the relationship between the number of initial programs (n<sub>p</sub>) and the number of feedback-repairs (n<sub>f</sub>). The heatmap uses a color gradient to represent numerical values, with warmer colors (orange/yellow) indicating lower values and cooler colors (green/dark green) indicating higher values. Several cells are marked with "O.O.B." which likely stands for "Out Of Bounds".
### Components/Axes
* **X-axis:** Number of initial programs (n<sub>p</sub>) with markers at 1, 2, 5, 10, and 25.
* **Y-axis:** Number of feedback-repairs (n<sub>f</sub>) with markers at 1, 3, 5, and 10.
* **Color Scale:** A gradient from orange to green, representing the numerical values within the heatmap cells. The scale is not explicitly provided, but the values within the cells suggest a continuous range.
* **Cells:** Each cell represents a combination of n<sub>p</sub> and n<sub>f</sub>, with a numerical value displayed within.
* **"O.O.B." Label:** Appears in several cells, indicating values that are "Out Of Bounds" or not available/applicable.
### Detailed Analysis
The heatmap displays the following values:
* **n<sub>f</sub> = 1:**
* n<sub>p</sub> = 1: 0.98
* n<sub>p</sub> = 2: 1.01
* n<sub>p</sub> = 5: 1.04
* n<sub>p</sub> = 10: 1.06
* n<sub>p</sub> = 25: 1.09
* **n<sub>f</sub> = 3:**
* n<sub>p</sub> = 1: 0.93
* n<sub>p</sub> = 2: 0.99
* n<sub>p</sub> = 5: 1.04
* n<sub>p</sub> = 10: 1.08
* n<sub>p</sub> = 25: O.O.B.
* **n<sub>f</sub> = 5:**
* n<sub>p</sub> = 1: 0.91
* n<sub>p</sub> = 2: 0.98
* n<sub>p</sub> = 5: 1.04
* n<sub>p</sub> = 10: 1.08
* n<sub>p</sub> = 25: O.O.B.
* **n<sub>f</sub> = 10:**
* n<sub>p</sub> = 1: 0.90
* n<sub>p</sub> = 2: 0.98
* n<sub>p</sub> = 5: 1.05
* n<sub>p</sub> = 10: O.O.B.
* n<sub>p</sub> = 25: O.O.B.
The values generally increase as both n<sub>p</sub> and n<sub>f</sub> increase, but this trend is not consistent across all cells, and is interrupted by the "O.O.B." values. The values appear to be clustered around 1.0, with some variation.
### Key Observations
* The values tend to be lower when both n<sub>p</sub> and n<sub>f</sub> are small (bottom-left corner).
* The highest values are found when n<sub>f</sub> is relatively small and n<sub>p</sub> is moderate (e.g., n<sub>f</sub> = 1, n<sub>p</sub> = 25).
* The "O.O.B." values suggest that the model or experiment being represented has limitations or undefined behavior for certain combinations of n<sub>p</sub> and n<sub>f</sub>. Specifically, higher values of n<sub>f</sub> combined with higher values of n<sub>p</sub> result in out-of-bounds conditions.
* The values increase as n<sub>p</sub> increases for a fixed n<sub>f</sub>, up to a point where they become "O.O.B.".
### Interpretation
This heatmap likely represents the results of a simulation or experiment investigating the relationship between the number of initial programs and the number of feedback-repair cycles. The values within the cells could represent a metric such as efficiency, success rate, or cost. The increasing trend suggests that, up to a certain point, increasing the number of initial programs can improve the metric being measured. However, the "O.O.B." values indicate that there is a limit to this improvement, and that beyond a certain combination of n<sub>p</sub> and n<sub>f</sub>, the system becomes unstable or the metric is no longer meaningful.
The "O.O.B." values are particularly important. They suggest that the system being studied has constraints or limitations that prevent it from scaling indefinitely. This could be due to factors such as computational complexity, resource limitations, or inherent instability in the system. Further investigation would be needed to understand the specific reasons for these out-of-bounds conditions. The values being close to 1.0 suggest that the metric is a ratio or index, where 1.0 represents a baseline or ideal value.