## Heatmap: Performance Metrics by Initial Programs and Feedback-Repairs
### Overview
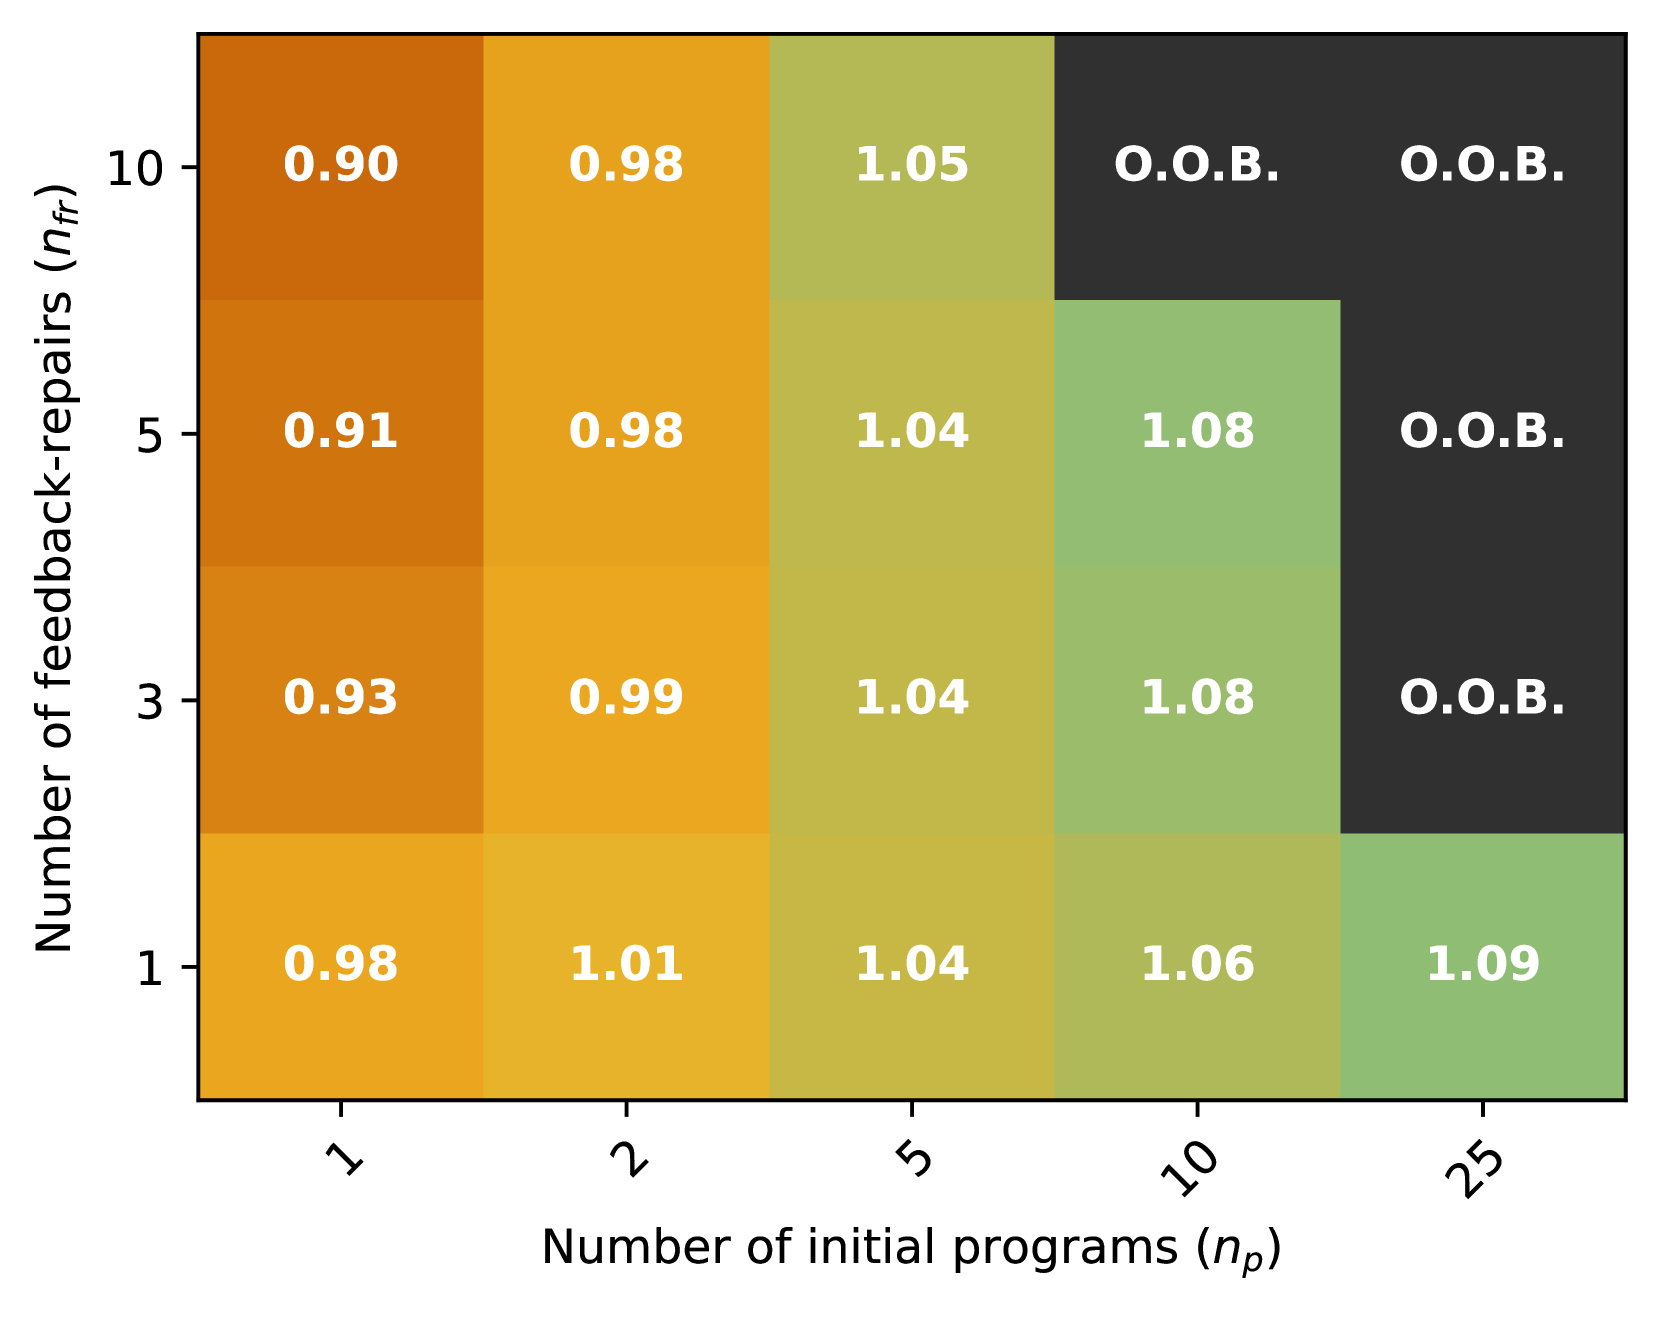
This image is a heatmap chart displaying numerical performance metrics (likely ratios or scores) across a grid defined by two parameters: the "Number of initial programs (n_p)" on the horizontal axis and the "Number of feedback-repairs (n_fr)" on the vertical axis. The cells are color-coded in a gradient from orange (lower values) through yellow-green to green (higher values), with a distinct dark gray used for cells labeled "O.O.B.".
### Components/Axes
* **X-Axis (Horizontal):** Labeled "Number of initial programs (n_p)". The categorical markers are, from left to right: `1`, `2`, `5`, `10`, `25`.
* **Y-Axis (Vertical):** Labeled "Number of feedback-repairs (n_fr)". The categorical markers are, from bottom to top: `1`, `3`, `5`, `10`.
* **Legend/Color Scale:** There is no explicit legend. The color gradient is implicit:
* **Orange tones:** Represent values below 1.00 (e.g., 0.90, 0.91).
* **Yellow-Green tones:** Represent values around 1.00 to 1.05.
* **Green tones:** Represent values above 1.05 (e.g., 1.06, 1.08, 1.09).
* **Dark Gray:** Represents the label "O.O.B." (likely meaning "Out Of Bounds" or a failure condition).
* **Data Grid:** A 4-row (n_fr) by 5-column (n_p) matrix of cells, each containing a numerical value or the text "O.O.B.".
### Detailed Analysis
The following table reconstructs the data from the heatmap. Values are read from the image with high confidence. The color description is based on the visual gradient.
| n_fr (y-axis) \ n_p (x-axis) | **1** | **2** | **5** | **10** | **25** |
| :--- | :--- | :--- | :--- | :--- | :--- |
| **10** | 0.90 (Orange) | 0.98 (Yellow-Orange) | 1.05 (Light Green) | O.O.B. (Dark Gray) | O.O.B. (Dark Gray) |
| **5** | 0.91 (Orange) | 0.98 (Yellow-Orange) | 1.04 (Yellow-Green) | 1.08 (Green) | O.O.B. (Dark Gray) |
| **3** | 0.93 (Orange) | 0.99 (Yellow) | 1.04 (Yellow-Green) | 1.08 (Green) | O.O.B. (Dark Gray) |
| **1** | 0.98 (Yellow-Orange) | 1.01 (Yellow) | 1.04 (Yellow-Green) | 1.06 (Green) | 1.09 (Green) |
**Trend Verification:**
* **Horizontal Trend (Increasing n_p):** For any fixed row (n_fr), moving from left to right, the numerical values generally increase. The color shifts from orange/yellow towards green. This trend is interrupted by "O.O.B." entries in the rightmost columns for higher n_fr values.
* **Vertical Trend (Increasing n_fr):** For any fixed column (n_p), moving from bottom to top, the numerical values show a slight decrease or remain stable. For example, at n_p=1, values go from 0.98 (n_fr=1) down to 0.90 (n_fr=10). The color becomes a slightly deeper orange. The exception is the n_p=10 column, where the value increases from 1.06 to 1.08 before hitting O.O.B.
### Key Observations
1. **Performance Threshold:** The highest numerical values (1.08, 1.09) are found in the lower-right region of the grid (high n_p, low n_fr).
2. **"O.O.B." Region:** The "Out Of Bounds" condition appears in a contiguous block in the top-right corner of the heatmap. It occurs when both parameters are high: specifically, for n_p=25 at all n_fr levels except 1, and for n_p=10 when n_fr=10.
3. **Color-Value Correlation:** The color gradient is consistent with the numerical values. The darkest orange corresponds to the lowest value (0.90), and the most vibrant green corresponds to the highest value (1.09).
4. **Stability at Low n_fr:** The bottom row (n_fr=1) is the only row without any "O.O.B." entries, showing a clean progression from 0.98 to 1.09 as n_p increases.
### Interpretation
This heatmap likely illustrates the results of an experiment or simulation in software engineering or automated program repair, where `n_p` is the number of candidate programs generated initially, and `n_fr` is the number of iterative repair cycles applied.
* **What the data suggests:** The metric (values around 0.9 to 1.1) appears to be a performance ratio, possibly comparing the final program's quality or correctness to a baseline. A value of 1.00 would indicate parity. Values below 1.00 (orange) indicate worse-than-baseline performance, while values above 1.00 (green) indicate improvement.
* **Relationship between elements:** The data demonstrates a trade-off. Increasing the number of initial programs (`n_p`) generally improves the outcome (higher values), but only up to a point. Combining a high number of initial programs with a high number of feedback-repair cycles (`n_fr`) leads to a failure state ("O.O.B."), suggesting the process becomes unstable, times out, or produces invalid results under those resource-intensive conditions.
* **Notable Pattern:** The most successful and stable configuration appears to be a moderate-to-high number of initial programs (n_p=10 or 25) paired with a low number of repair cycles (n_fr=1). This yields the highest scores (1.06-1.09) without triggering failure. The system seems sensitive to excessive iterative repair when starting with many candidates.