## Heatmap: Correlation Between Feedback-Repairs and Initial Programs
### Overview
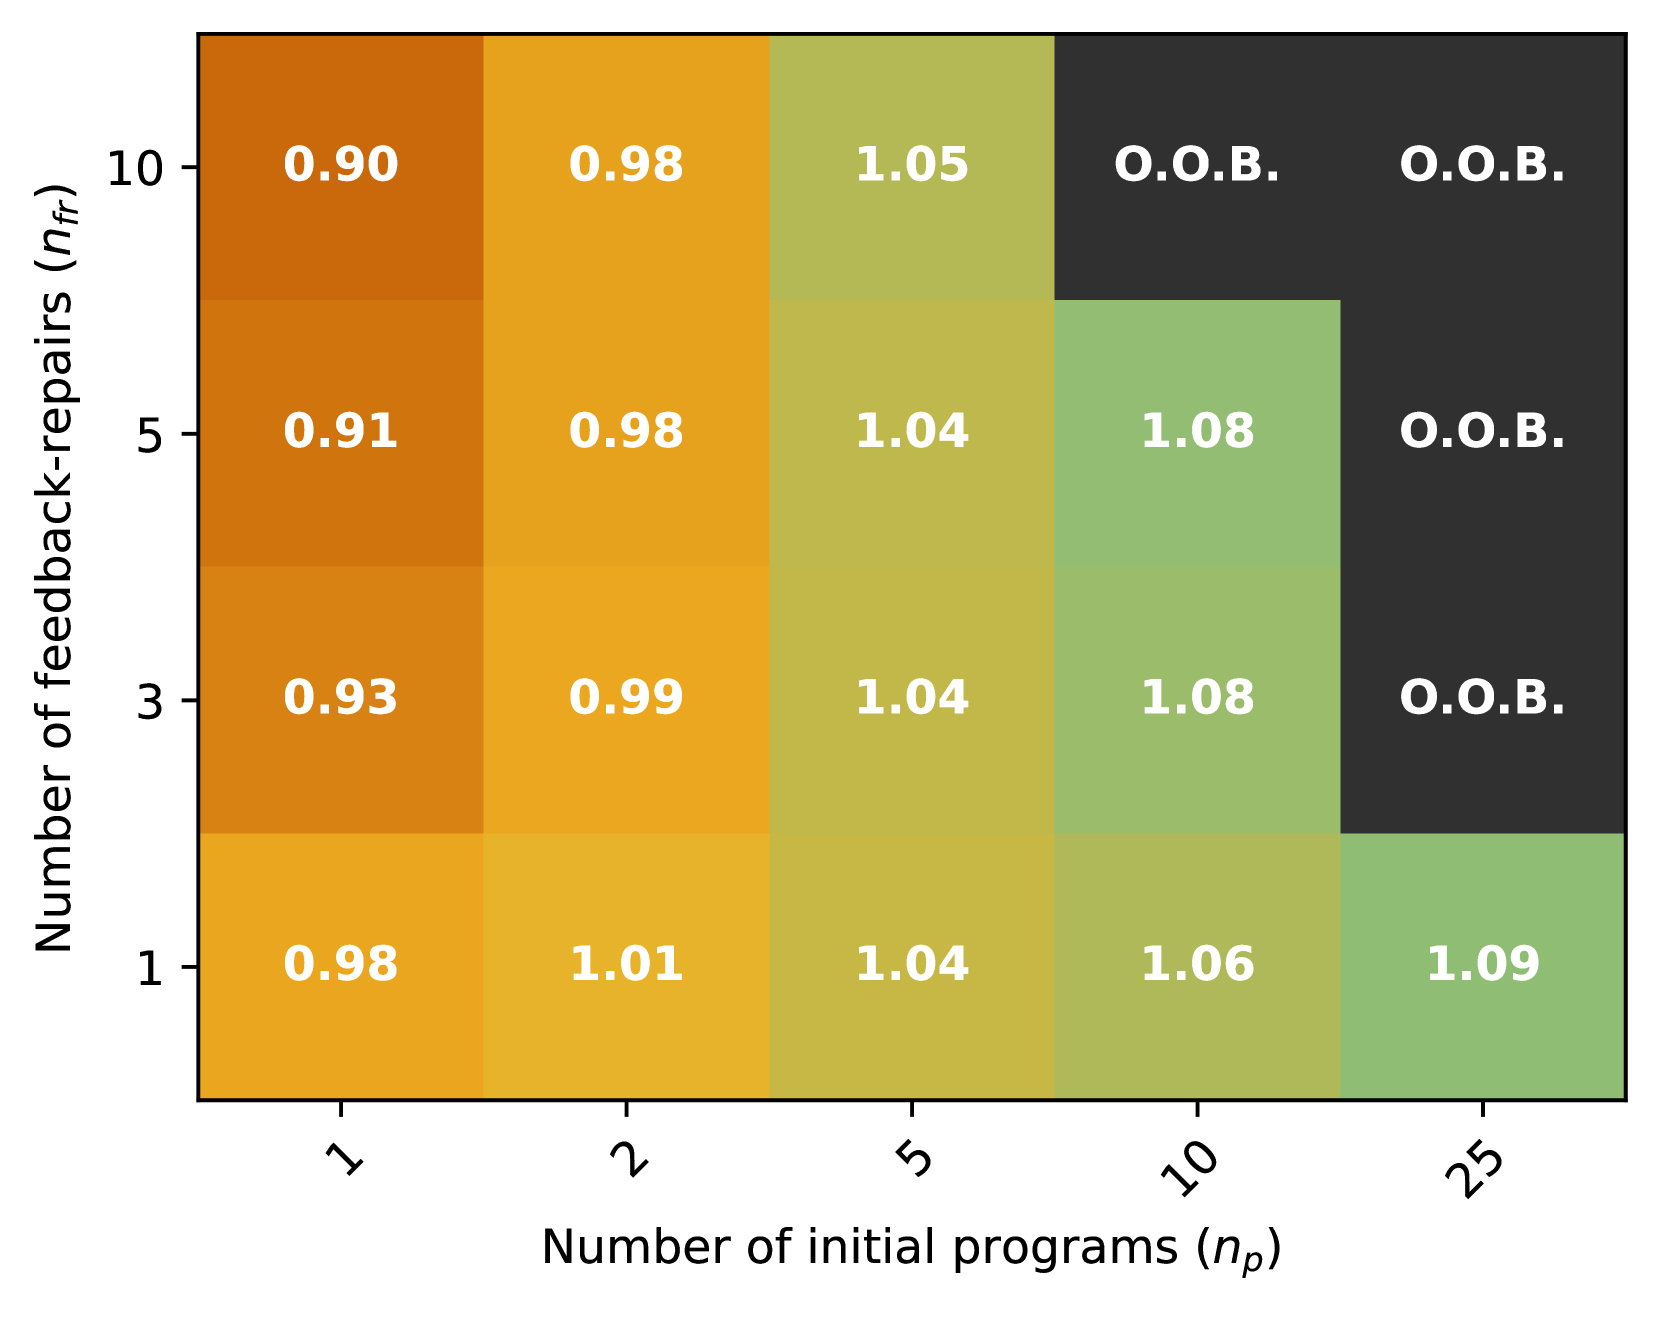
The image is a heatmap visualizing the relationship between the number of feedback-repairs (`n_fr`) and the number of initial programs (`n_p`). Values are represented numerically in grid cells, with color gradients transitioning from orange (low values) to green (mid values) to black (high values). Some cells are marked "O.O.B." (Out of Bounds), indicating undefined or non-applicable results.
---
### Components/Axes
- **Y-Axis (Vertical)**: "Number of feedback-repairs (`n_fr`)" with values: 1, 3, 5, 10.
- **X-Axis (Horizontal)**: "Number of initial programs (`n_p`)" with values: 1, 2, 5, 10, 25.
- **Grid Cells**: Each cell contains a numerical value (e.g., 0.90, 1.05) or "O.O.B.".
- **Color Gradient**:
- Orange (low values, e.g., 0.90–0.99),
- Green (mid values, e.g., 1.04–1.08),
- Black (high values, e.g., 1.09 or O.O.B.).
---
### Detailed Analysis
#### Grid Values
| `n_p` \ `n_fr` | 1 | 2 | 5 | 10 | 25 |
|----------------|---------|---------|---------|---------|---------|
| **1** | 0.98 | 1.01 | 1.04 | 1.06 | 1.09 |
| **3** | 0.93 | 0.99 | 1.04 | 1.08 | O.O.B. |
| **5** | 0.91 | 0.98 | 1.04 | 1.08 | O.O.B. |
| **10** | 0.90 | 0.98 | 1.05 | O.O.B. | O.O.B. |
#### Color-Space Correlation
- **Orange** dominates the lower-left quadrant (small `n_p` and `n_fr`).
- **Green** appears in the mid-range (moderate `n_p` and `n_fr`).
- **Black** occupies the upper-right quadrant (large `n_p` and `n_fr`), with "O.O.B." indicating thresholds beyond which results are undefined.
---
### Key Observations
1. **Threshold Effects**:
- Values increase monotonically with `n_p` and `n_fr` until reaching ~1.09 (e.g., `n_p=25`, `n_fr=1`).
- Beyond `n_p=10` or `n_fr=10`, values transition to "O.O.B.", suggesting system limitations or undefined behavior at scale.
2. **Consistency in Mid-Range**:
- For `n_p=5` and `n_fr=3–5`, values stabilize at 1.04, indicating a plateau in the relationship.
3. **Asymmetry in High Values**:
- High `n_fr` (e.g., 10) combined with low `n_p` (e.g., 1) yields lower values (0.90) compared to high `n_p` with low `n_fr` (e.g., 1.09).
---
### Interpretation
The heatmap demonstrates a **non-linear relationship** between feedback-repairs and initial programs. While increasing either variable generally improves outcomes (higher values), the system exhibits **diminishing returns** and **threshold effects**:
- **Positive Correlation**: Up to `n_p=10` and `n_fr=10`, values rise predictably (e.g., 0.90 → 1.09).
- **System Saturation**: Beyond these thresholds, results become undefined ("O.O.B."), implying operational limits or resource exhaustion.
- **Asymmetry**: High `n_p` with low `n_fr` yields better results than the reverse, suggesting initial programs are more impactful than feedback-repairs in this context.
This pattern could reflect a scenario where initial program quality or quantity drives outcomes, while feedback-repairs become less effective or counterproductive at scale.