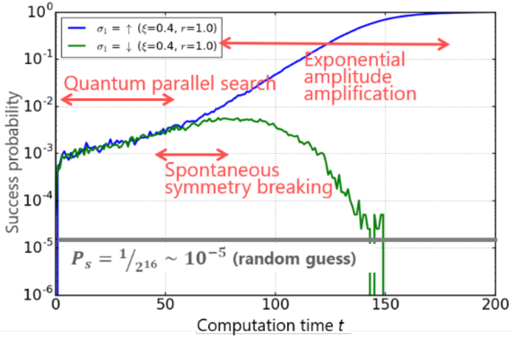
## Line Chart: Success Probability vs. Computation Time
### Overview
The image is a line chart comparing the success probability of two different configurations (sigma_I = up and sigma_I = down) over computation time. The y-axis represents the success probability on a logarithmic scale, and the x-axis represents the computation time. The chart also includes annotations highlighting different phases of the computation, such as "Quantum parallel search," "Exponential amplitude amplification," and "Spontaneous symmetry breaking." A horizontal line indicates the success probability of a random guess.
### Components/Axes
* **Title:** Implicit, but the chart depicts "Success probability vs. Computation time."
* **X-axis:**
* Label: "Computation time t"
* Scale: Linear, ranging from 0 to 200, with tick marks at intervals of 50 (0, 50, 100, 150, 200).
* **Y-axis:**
* Label: "Success probability"
* Scale: Logarithmic (base 10), ranging from 10^-6 to 10^0, with tick marks at each power of 10 (10^-6, 10^-5, 10^-4, 10^-3, 10^-2, 10^-1, 10^0).
* **Legend:** Located at the top-left of the chart.
* Blue line: "σ_I = ↑ (ξ=0.4, r=1.0)"
* Green line: "σ_I = ↓ (ξ=0.4, r=1.0)"
* **Horizontal Line:** A gray horizontal line is present at approximately 10^-5, labeled "P_s = 1/2^16 ~ 10^-5 (random guess)".
* **Annotations:**
* "Quantum parallel search" (horizontal arrow, left side)
* "Exponential amplitude amplification" (horizontal arrow, right side)
* "Spontaneous symmetry breaking" (horizontal arrow, center)
### Detailed Analysis
* **Blue Line (σ_I = ↑ (ξ=0.4, r=1.0)):**
* Trend: Initially increases slowly during the "Quantum parallel search" phase, then exhibits a rapid, almost exponential increase during the "Exponential amplitude amplification" phase.
* Data Points:
* At t=0, Success Probability ≈ 10^-6
* At t=50, Success Probability ≈ 10^-3
* At t=100, Success Probability ≈ 10^-2
* At t=150, Success Probability ≈ 10^-1
* At t=200, Success Probability ≈ Approaching 10^0
* **Green Line (σ_I = ↓ (ξ=0.4, r=1.0)):**
* Trend: Initially increases slowly during the "Quantum parallel search" phase, then peaks and decreases during the "Spontaneous symmetry breaking" phase.
* Data Points:
* At t=0, Success Probability ≈ 10^-6
* At t=50, Success Probability ≈ 2 * 10^-3
* At t=100, Success Probability ≈ 3 * 10^-3
* At t=150, Success Probability ≈ 10^-5
* At t=200, Success Probability ≈ 10^-6
* **Horizontal Line (Random Guess):**
* Value: Approximately 10^-5. This represents the baseline success probability achieved by a random guess.
### Key Observations
* The blue line (σ_I = ↑) shows a significantly higher success probability at later computation times compared to the green line (σ_I = ↓).
* The green line (σ_I = ↓) exhibits a peak in success probability around t=100, followed by a decrease, indicating a "Spontaneous symmetry breaking" phenomenon.
* Both lines start at the same initial success probability (approximately 10^-6).
* The "Exponential amplitude amplification" phase is only evident in the blue line.
* The success probability of the blue line surpasses the random guess probability around t=60, while the green line's success probability drops below the random guess probability after t=120.
### Interpretation
The chart demonstrates the performance of two different configurations (σ_I = ↑ and σ_I = ↓) in a quantum computation task. The blue line represents a configuration that effectively utilizes "Exponential amplitude amplification" to achieve a high success probability. In contrast, the green line shows a "Spontaneous symmetry breaking" phenomenon, where the success probability decreases after reaching a peak. This suggests that the configuration represented by the blue line is more suitable for this particular computation task. The horizontal line representing the random guess probability provides a baseline for evaluating the effectiveness of the quantum computation. The fact that the blue line significantly exceeds this baseline indicates a successful quantum algorithm, while the green line's eventual drop below the baseline suggests a less effective or even detrimental configuration.