\n
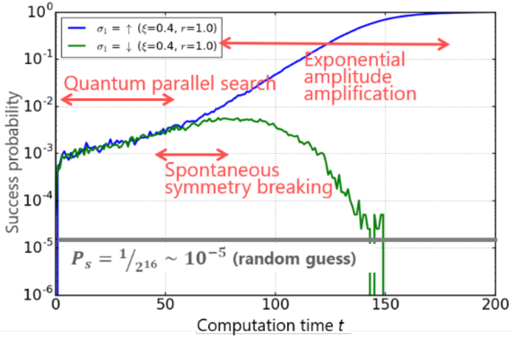
## Chart: Quantum Search Success Probability vs. Computation Time
### Overview
The image presents a chart illustrating the success probability of a quantum search algorithm as a function of computation time. Two curves are plotted, representing different configurations of the algorithm (σ₁ = ↑ and σ₁ = ↓). The chart demonstrates the concept of quantum parallel search and exponential amplitude amplification, contrasting it with the performance of a random guess.
### Components/Axes
* **X-axis:** Computation time *t* (ranging from 0 to approximately 200).
* **Y-axis:** Success probability (logarithmic scale, ranging from 10⁻⁶ to 10⁰).
* **Curves:**
* Blue solid line: σ₁ = ↑ (ξ=0.4, r=1.0) - Represents the quantum search with a specific configuration.
* Green solid line: σ₁ = ↓ (ξ=0.4, r=1.0) - Represents the quantum search with a different configuration.
* **Horizontal dashed line:** P<sub>s</sub> = 1/2¹⁶ ≈ 10⁻⁵ (random guess) - Indicates the success probability of a random guess.
* **Annotations (Red Arrows):**
* "Quantum parallel search" pointing to the initial rise of the green line.
* "Exponential amplitude amplification" pointing to the upward slope of the blue line.
* "Spontaneous symmetry breaking" pointing to the decline of the green line.
### Detailed Analysis
* **Blue Line (σ₁ = ↑):** The blue line starts at approximately 2 x 10⁻⁴ at t=0 and exhibits a generally upward trend. It increases relatively slowly until around t=100, then shows a steeper increase, reaching approximately 0.8 at t=180. The trend is exponential.
* **Green Line (σ₁ = ↓):** The green line begins at approximately 3 x 10⁻³ at t=0. It initially decreases slowly, then experiences a more rapid decline around t=120. It reaches a minimum of approximately 1 x 10⁻⁶ around t=160, then exhibits several oscillations before stabilizing at approximately 1 x 10⁻⁶.
* **Random Guess Line:** The horizontal dashed line remains constant at approximately 1 x 10⁻⁵ throughout the entire computation time.
* **Intersection Point:** The blue line crosses the random guess line at approximately t=70, indicating that the quantum search algorithm surpasses the performance of a random guess at this point.
* **Oscillations:** The green line exhibits several small oscillations between t=150 and t=180, with peaks reaching approximately 3 x 10⁻⁵.
### Key Observations
* The blue line (σ₁ = ↑) demonstrates exponential amplitude amplification, leading to a significantly higher success probability compared to the random guess.
* The green line (σ₁ = ↓) exhibits spontaneous symmetry breaking, resulting in a decrease in success probability.
* The random guess line provides a baseline for comparison, highlighting the advantage of the quantum search algorithm.
* The initial phase of the green line suggests a period of quantum parallel search before symmetry breaking occurs.
### Interpretation
The chart illustrates the fundamental principles of a quantum search algorithm. The blue line demonstrates how exponential amplitude amplification can significantly enhance the probability of finding a solution, surpassing the performance of a classical random search. The green line represents a scenario where spontaneous symmetry breaking occurs, leading to a decrease in success probability. This suggests that the algorithm's performance is sensitive to initial conditions or configuration parameters (ξ and r). The horizontal line representing the random guess provides a crucial benchmark, demonstrating the quantum advantage achieved by the algorithm. The oscillations in the green line after the initial decline could indicate interference effects or the algorithm settling into a suboptimal state. The chart effectively visualizes the trade-offs and dynamics involved in quantum search, highlighting the potential for significant speedups but also the challenges of maintaining coherence and avoiding symmetry breaking.