## Line Chart: Quantum Search Success Probability vs. Computation Time
### Overview
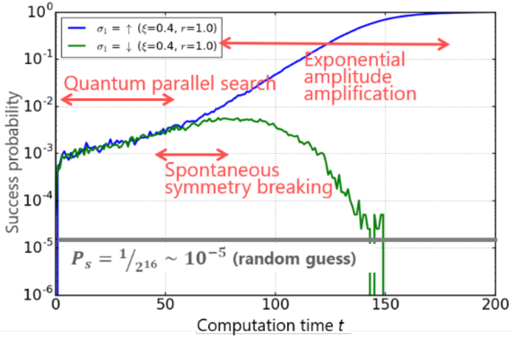
This is a logarithmic line chart comparing the success probability over computation time for two different initial states (σ₁) in a quantum search algorithm. The chart includes annotations describing distinct phases of the process and a baseline for random guessing.
### Components/Axes
* **X-Axis:** Labeled "Computation time t". Linear scale with major ticks at 0, 50, 100, 150, and 200.
* **Y-Axis:** Labeled "Success probability". Logarithmic scale (base 10) ranging from 10⁻⁶ to 10⁰ (1). Major ticks are at every power of 10.
* **Legend:** Located in the top-left corner.
* **Blue Line:** `σ₁ = ↑ (ζ=0.4, r=1.0)`
* **Green Line:** `σ₁ = ↓ (ζ=0.4, r=1.0)`
* **Baseline:** A horizontal gray line at approximately `10⁻⁵`. It is labeled: `P_s = 1/2^16 ~ 10^-5 (random guess)`.
* **Annotations (Red Text with Arrows):**
1. **"Quantum parallel search"**: Positioned in the upper-left quadrant. A double-headed arrow spans horizontally from approximately t=0 to t=60, pointing to the initial rising phase of both lines.
2. **"Exponential amplitude amplification"**: Positioned in the upper-right quadrant. A double-headed arrow spans horizontally from approximately t=100 to t=180, pointing to the continued rise and plateau of the blue line.
3. **"Spontaneous symmetry breaking"**: Positioned in the center. A double-headed arrow spans horizontally from approximately t=60 to t=100, pointing to the region where the green line begins to diverge downward from the blue line's trajectory.
### Detailed Analysis
* **Blue Line (σ₁ = ↑):**
* **Trend:** Starts near 10⁻⁵ at t=0, rises steeply and noisily until about t=60 (reaching ~10⁻²), then continues a smoother, concave-upward rise, approaching a plateau near 10⁰ (1) by t=200.
* **Key Points (Approximate):**
* t=0: ~10⁻⁵
* t=50: ~10⁻³
* t=100: ~10⁻¹
* t=150: ~0.5
* t=200: ~0.9-1.0
* **Green Line (σ₁ = ↓):**
* **Trend:** Follows a similar initial noisy rise as the blue line until approximately t=60-70, reaching a peak near 10⁻². It then enters a declining phase, dropping below the random guess baseline (~10⁻⁵) around t=140 and continuing to fall towards 10⁻⁶ by t=150.
* **Key Points (Approximate):**
* t=0: ~10⁻⁵
* t=50: ~10⁻³ (similar to blue line)
* t=70 (Peak): ~10⁻²
* t=100: ~10⁻³
* t=140: Crosses below 10⁻⁵
* t=150: ~10⁻⁶
* **Random Guess Baseline:** Constant at `P_s = 1/2^16 ≈ 1.53 × 10⁻⁵`.
### Key Observations
1. **Divergence Point:** The two data series, initially indistinguishable, begin to diverge significantly around t=60-70, coinciding with the "Spontaneous symmetry breaking" annotation.
2. **Opposite Fates:** The blue line (σ₁ = ↑) achieves near-certain success (probability ~1), while the green line (σ₁ = ↓) performs worse than random guessing after t=140.
3. **Phase Annotations:** The chart explicitly labels three conceptual phases: an initial parallel search phase (both lines rise), a symmetry-breaking event (lines diverge), and a final amplification phase (only the blue line benefits).
4. **Noise:** Both lines exhibit significant high-frequency noise or fluctuations, particularly during the initial rise (t < 70).
### Interpretation
This chart visually demonstrates the critical impact of initial state symmetry on the outcome of a quantum search algorithm. The data suggests:
* **Symmetry is Crucial:** The algorithm's success is not guaranteed and is highly sensitive to the initial condition (σ₁). The "↑" state leads to constructive interference and amplitude amplification, while the "↓" state leads to destructive interference after symmetry breaking.
* **Algorithmic Phases:** The process can be segmented into: 1) A **quantum parallel search** phase where both states explore the solution space similarly, 2) A **spontaneous symmetry breaking** phase where the system's evolution bifurcates based on the initial state, and 3) An **exponential amplitude amplification** phase where the "correct" state's probability is boosted to near certainty.
* **Performance vs. Random:** The blue line's trajectory shows the quantum algorithm provides an exponential speedup over classical random guessing (the gray baseline). Conversely, the green line shows that a poor initial choice can lead to performance *worse* than random, likely due to the algorithm actively suppressing the probability of the "wrong" state.
* **Underlying Mechanism:** The terms used ("symmetry breaking," "amplitude amplification") point to this being a simulation or model of a quantum algorithm like Grover's search, but with an added symmetry parameter (ζ, r) that determines the initial state's alignment with the solution. The divergence is a hallmark of quantum dynamics where small initial differences are amplified exponentially.