## Time Series Charts: Phase and Cut Parameter Evolution
### Overview
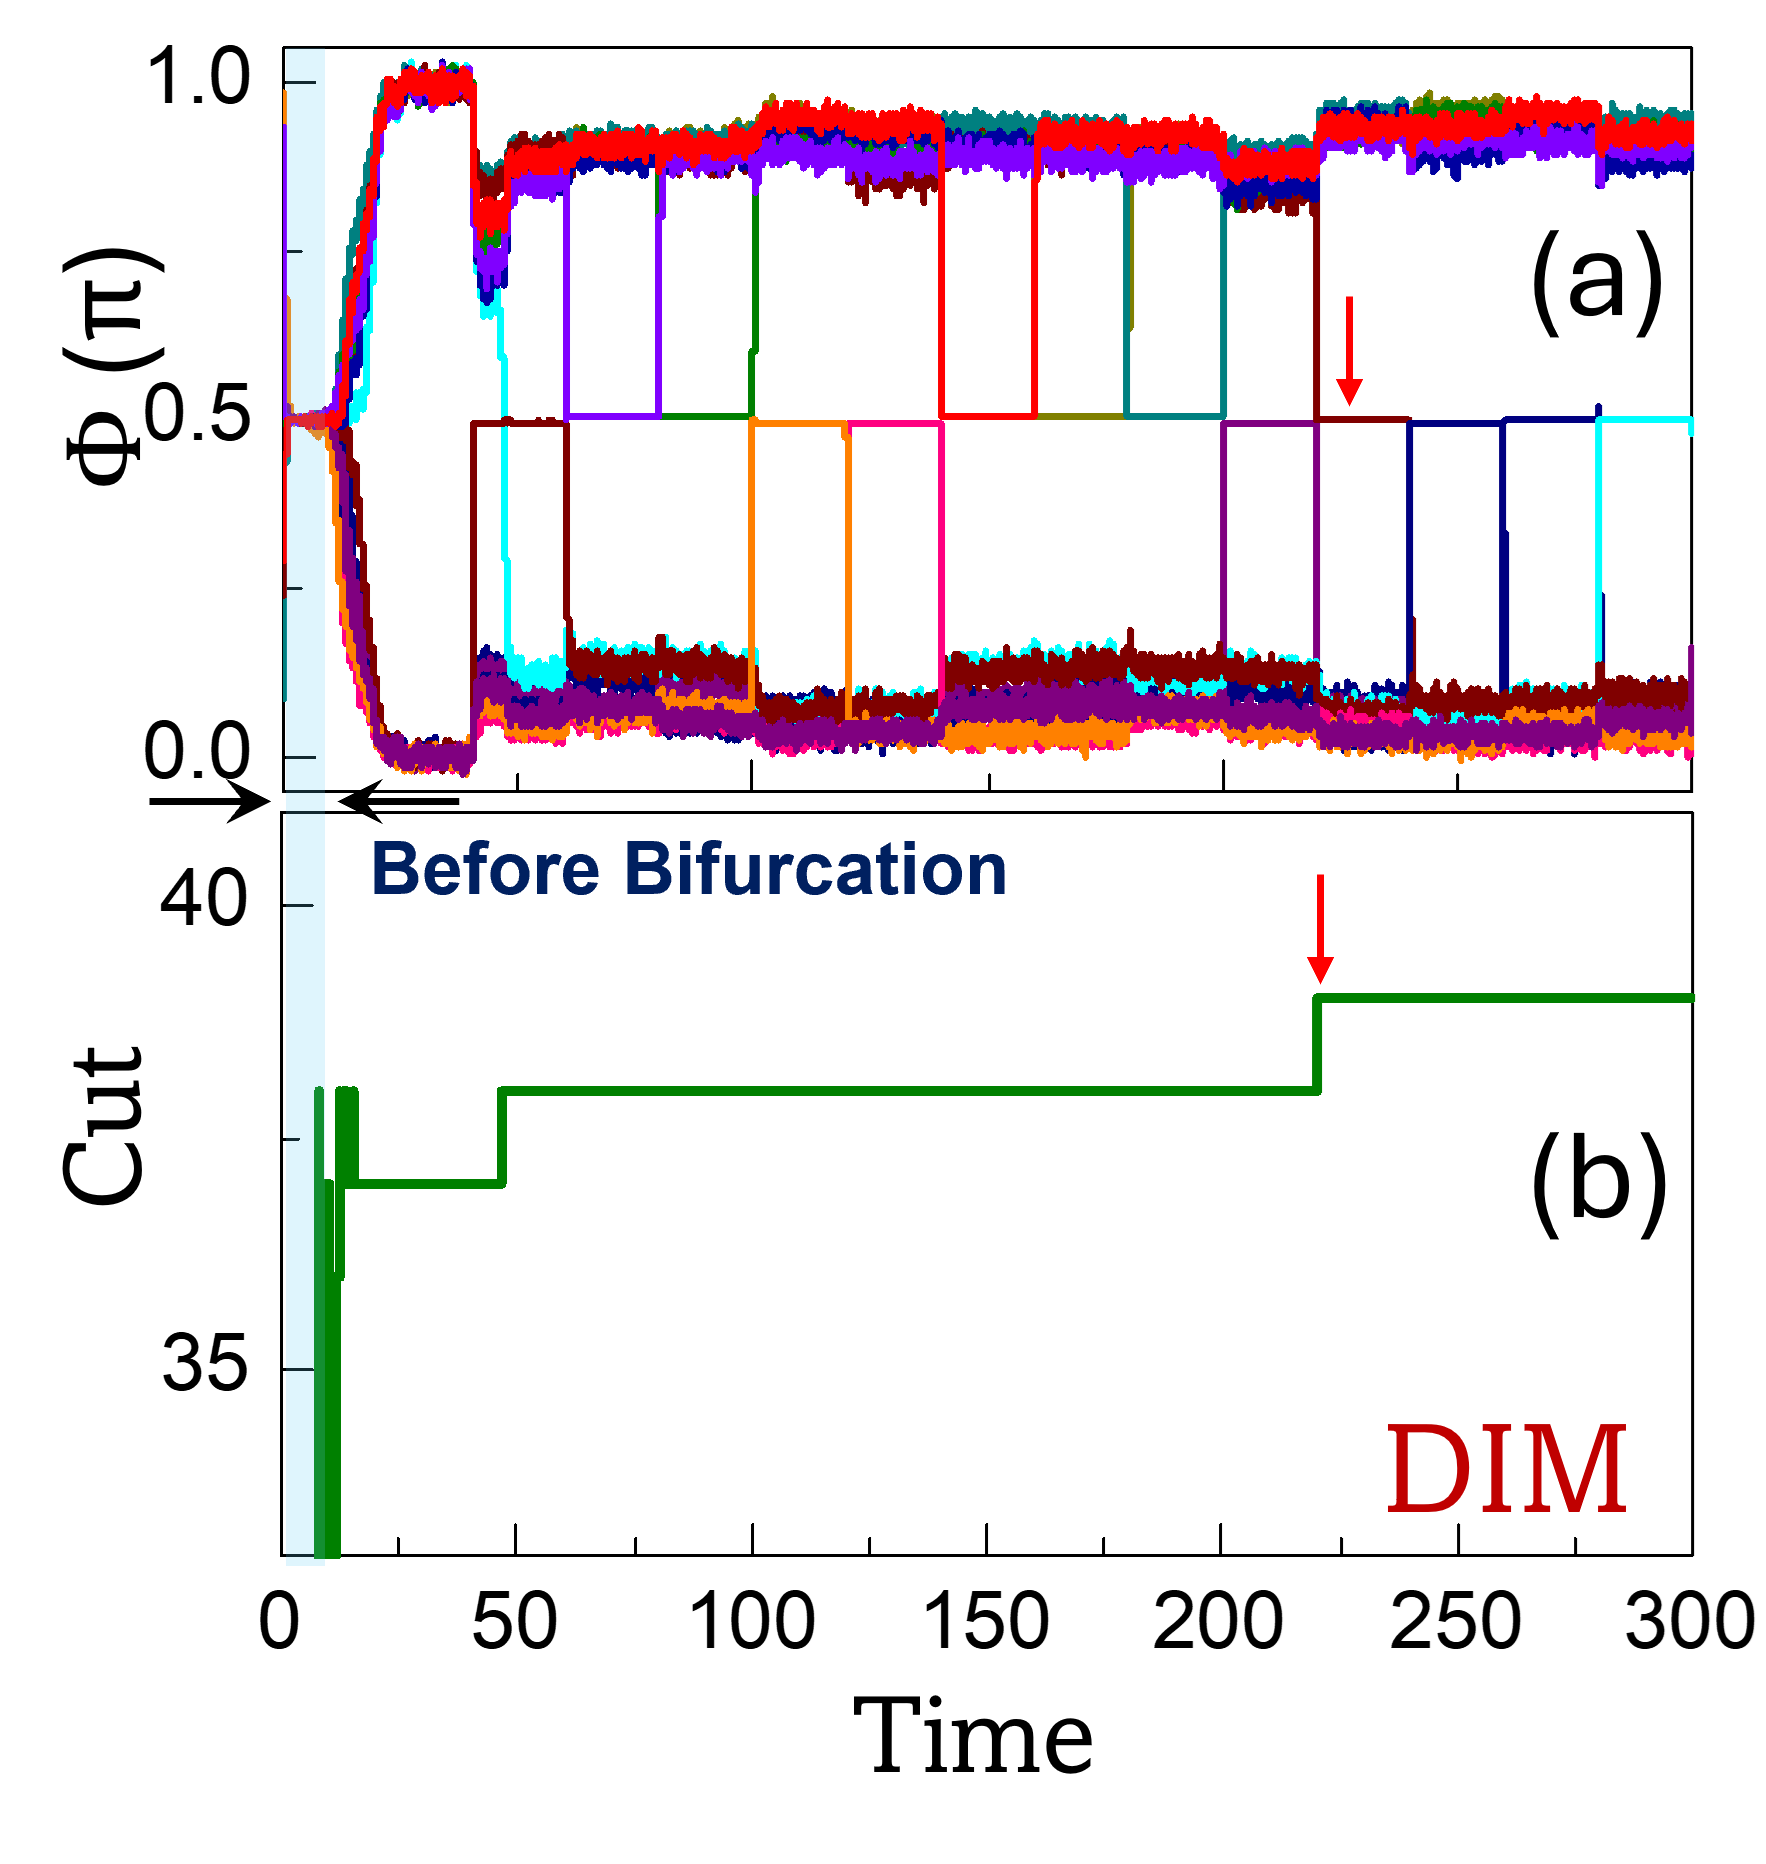
The image presents two time series charts, (a) and (b), stacked vertically. Chart (a) displays the evolution of phase (φ) in units of π over time, with multiple colored lines representing different data series. Chart (b) shows the evolution of a "Cut" parameter over time, represented by a single green line. A vertical light blue shaded region highlights a period "Before Bifurcation".
### Components/Axes
**Chart (a):**
* **Y-axis:** φ(π), ranging from 0.0 to 1.0 in increments of 0.5.
* **X-axis:** Time, implicitly ranging from 0 to 300 (based on chart (b)).
* **Data Series:** Multiple colored lines (red, purple, green, orange, dark red, cyan, blue, pink) each representing a different phase evolution.
* **Title:** (a) in the top-right corner.
**Chart (b):**
* **Y-axis:** Cut, ranging from 35 to 40 in increments of 5.
* **X-axis:** Time, ranging from 0 to 300 in increments of 50.
* **Data Series:** A single green line representing the "Cut" parameter.
* **Title:** (b) in the top-right corner.
* **Additional Text:** "DIM" in red text, located in the bottom-right.
* **Annotation:** "Before Bifurcation" in blue text, above the plot, with a left-pointing arrow indicating the region.
### Detailed Analysis
**Chart (a): Phase Evolution**
* **Initial Phase (Time = 0):** The phase values for all series start near 0.5π.
* **Before Bifurcation (Time < ~20):** Within the light blue shaded region, the phase values rapidly diverge. Some series increase towards 1.0π, while others decrease towards 0.0π.
* **After Bifurcation (Time > ~20):** The phase values stabilize around either 0.0π or 1.0π, with some series exhibiting switching behavior between these two states.
* **Specific Series Trends:**
* **Red Line:** Starts at approximately 0.5π, increases rapidly to approximately 1.0π, and remains relatively stable with minor fluctuations.
* **Purple Line:** Starts at approximately 0.5π, decreases rapidly to approximately 0.0π, and remains relatively stable with minor fluctuations.
* **Green Line:** Starts at approximately 0.5π, increases rapidly to approximately 1.0π, and exhibits switching behavior, dropping to approximately 0.5π around time = 100, then returning to 1.0π.
* **Orange Line:** Starts at approximately 0.5π, decreases rapidly to approximately 0.0π, and remains relatively stable with minor fluctuations.
* **Dark Red Line:** Starts at approximately 0.5π, decreases rapidly to approximately 0.0π, and remains relatively stable with minor fluctuations.
* **Cyan Line:** Starts at approximately 0.5π, decreases rapidly to approximately 0.0π, and exhibits switching behavior, increasing to approximately 0.5π around time = 75, then returning to 0.0π.
* **Blue Line:** Starts at approximately 0.5π, increases rapidly to approximately 1.0π, and exhibits switching behavior, dropping to approximately 0.5π around time = 225, then returning to 1.0π.
* **Pink Line:** Starts at approximately 0.5π, decreases rapidly to approximately 0.0π, and remains relatively stable with minor fluctuations.
**Chart (b): Cut Parameter Evolution**
* **Initial Value (Time = 0):** The "Cut" parameter starts at approximately 37.
* **Step Changes:** The parameter exhibits step-like increases at approximately Time = 10 and Time = 50.
* **Final Value (Time > ~225):** The parameter reaches a final value of approximately 39 and remains stable.
### Key Observations
* **Bifurcation Point:** The light blue shaded region highlights a critical point where the system undergoes a bifurcation, leading to distinct phase states.
* **Phase Locking:** After the bifurcation, the phase values tend to lock into either 0.0π or 1.0π.
* **Switching Behavior:** Some phase series exhibit switching between the two locked states.
* **Correlation:** The "Cut" parameter increases in steps, potentially influencing the switching behavior observed in the phase series.
### Interpretation
The charts illustrate the dynamics of a system undergoing a bifurcation. Before the bifurcation, the phase values are similar. After the bifurcation, the system splits into two distinct phase states (0.0π and 1.0π), indicating a symmetry breaking. The "Cut" parameter, which increases in steps, may represent an external control parameter that influences the system's behavior and potentially triggers the switching between phase states. The "DIM" label is likely an identifier for the specific experimental or simulation setup. The data suggests that the system's behavior is sensitive to the "Cut" parameter, which drives the system towards different stable states after the initial bifurcation.