## Chart: Bifurcation Diagram and Cut Value Over Time
### Overview
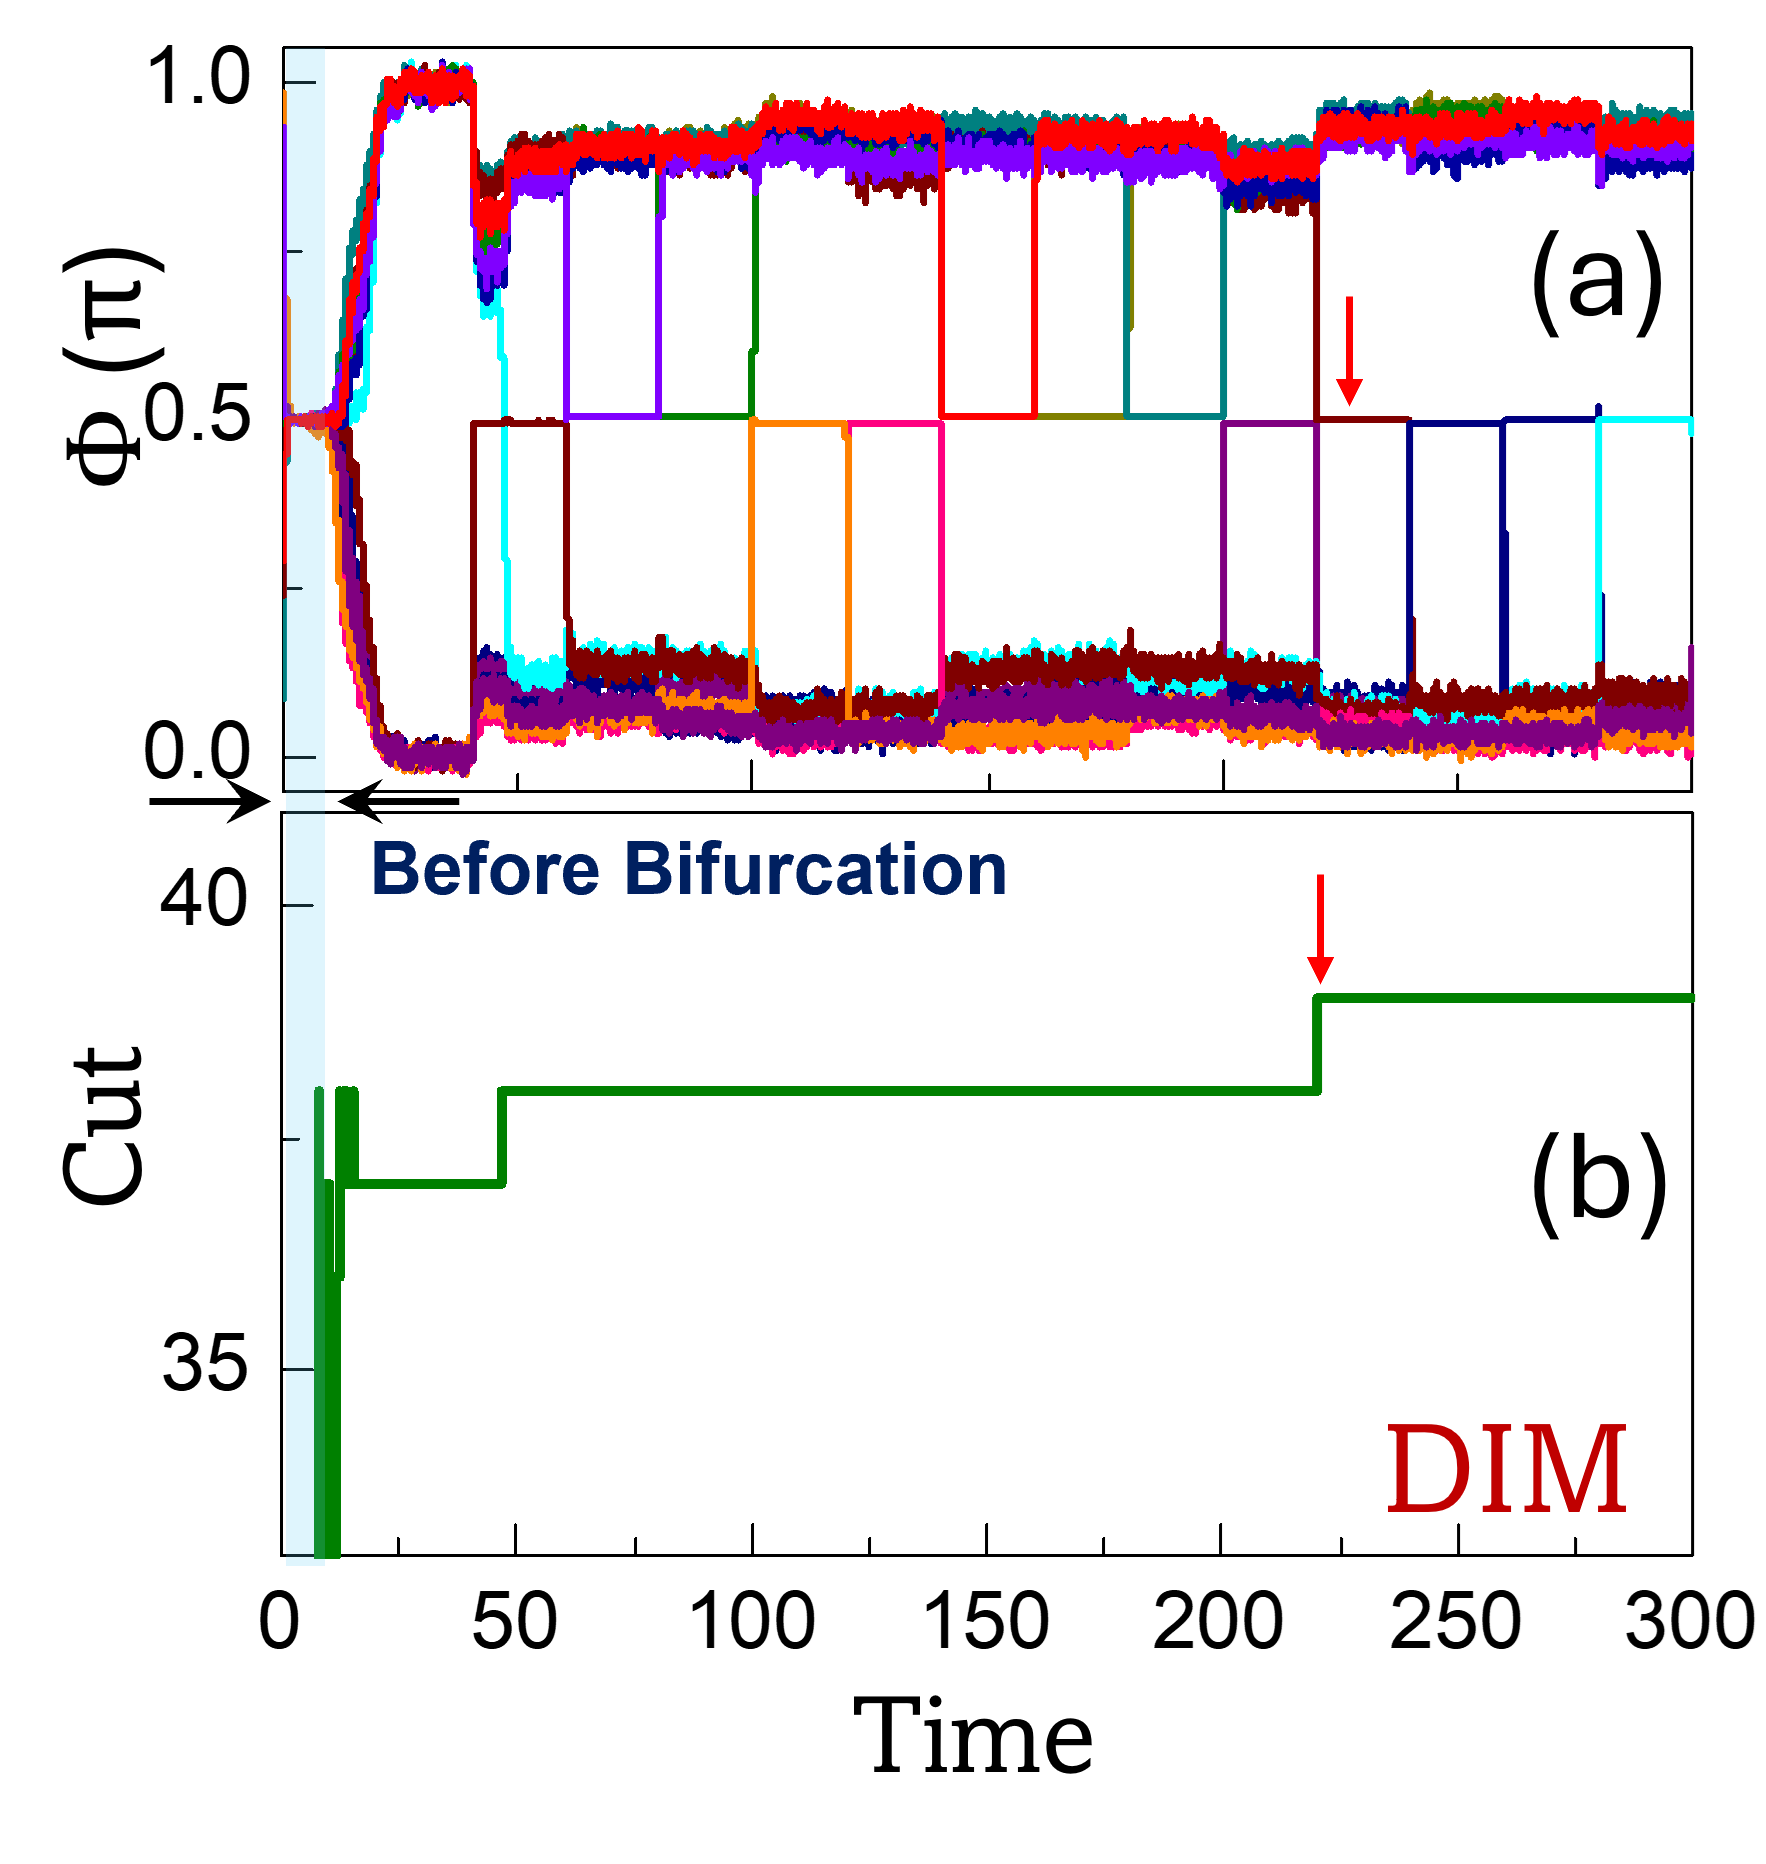
The image presents two time-series plots, labeled (a) and (b). Plot (a) displays a series of fluctuating lines representing a quantity denoted as Φ (in radians, π), plotted against Time. Plot (b) shows a step-like function representing "Cut" value, also plotted against Time. A red arrow indicates a point of interest in both plots. The text "Before Bifurcation" is placed above the initial portion of plot (a). The label "DIM" is present in the bottom-right corner of the image.
### Components/Axes
* **Plot (a):**
* X-axis: Time (units not specified, ranging from 0 to 300)
* Y-axis: Φ (π) (ranging from 0 to 1.0)
* Multiple lines representing different trajectories or conditions. The lines are colored: blue, orange, yellow, red, purple, green, and several shades of red/brown.
* **Plot (b):**
* X-axis: Time (units not specified, ranging from 0 to 300)
* Y-axis: Cut (ranging from approximately 32 to 40)
* A single green line representing the Cut value.
* **Annotations:**
* Red arrow pointing to approximately Time = 225 in both plots.
* Text: "Before Bifurcation" positioned above the initial portion of plot (a).
* Text: "DIM" in the bottom-right corner.
### Detailed Analysis or Content Details
**Plot (a): Φ vs. Time**
The plot shows multiple lines fluctuating between approximately 0 and 1.0. Initially (before Time = 50), the lines exhibit relatively high frequency oscillations. After Time = 50, the lines settle into more stable, but still fluctuating, patterns. The lines are not all identical; there is variation in their amplitude and frequency.
* **Blue Line:** Starts at approximately Φ = 0.8, drops to near 0, then fluctuates between 0.2 and 0.6.
* **Orange Line:** Starts at approximately Φ = 0.7, drops to near 0, then fluctuates between 0.2 and 0.7.
* **Yellow Line:** Starts at approximately Φ = 0.6, drops to near 0, then fluctuates between 0.1 and 0.5.
* **Red Line:** Starts at approximately Φ = 0.5, drops to near 0, then fluctuates between 0.1 and 0.4.
* **Purple Line:** Starts at approximately Φ = 0.4, drops to near 0, then fluctuates between 0.1 and 0.3.
* **Green Line:** Starts at approximately Φ = 0.3, drops to near 0, then fluctuates between 0.1 and 0.2.
* **Brown/Red Lines:** Several lines with similar behavior, fluctuating between 0.1 and 0.5.
Around Time = 225 (indicated by the red arrow), there appears to be a change in the behavior of the lines, with some lines exhibiting larger fluctuations.
**Plot (b): Cut vs. Time**
The plot shows a step-like function. The Cut value starts at approximately 37.5, drops to approximately 33 at Time = 0, remains relatively constant until Time = 200, then increases to approximately 39 at Time = 200. The value remains at approximately 39 until Time = 300. The red arrow indicates the step change at Time = 200.
### Key Observations
* The "Before Bifurcation" label suggests that the initial portion of plot (a) represents a state before a bifurcation event.
* The red arrow in both plots highlights a potential correlation between the change in the Cut value and a change in the behavior of the Φ values.
* The lines in plot (a) do not converge to a single value, indicating a complex system with multiple possible states.
* The Cut value in plot (b) is a control parameter that appears to influence the behavior of the system represented by plot (a).
### Interpretation
The data suggests a system undergoing a bifurcation, where a small change in a control parameter ("Cut") leads to a significant change in the system's behavior (represented by the fluctuating Φ values). The "Before Bifurcation" label indicates that the initial state is relatively stable, but as the Cut value is changed, the system enters a more complex and potentially chaotic regime. The multiple lines in plot (a) represent different possible trajectories or states of the system, and the fluctuations in Φ indicate sensitivity to initial conditions. The DIM label is unclear without further context, but it may refer to a specific dimension or parameter of the system. The correlation between the step change in Cut and the change in Φ suggests that the Cut value is a key driver of the bifurcation. The system appears to be sensitive to changes in the Cut parameter, leading to a shift in the dynamics of the system.