## Line Graph with Step Function: Bifurcation Analysis
### Overview
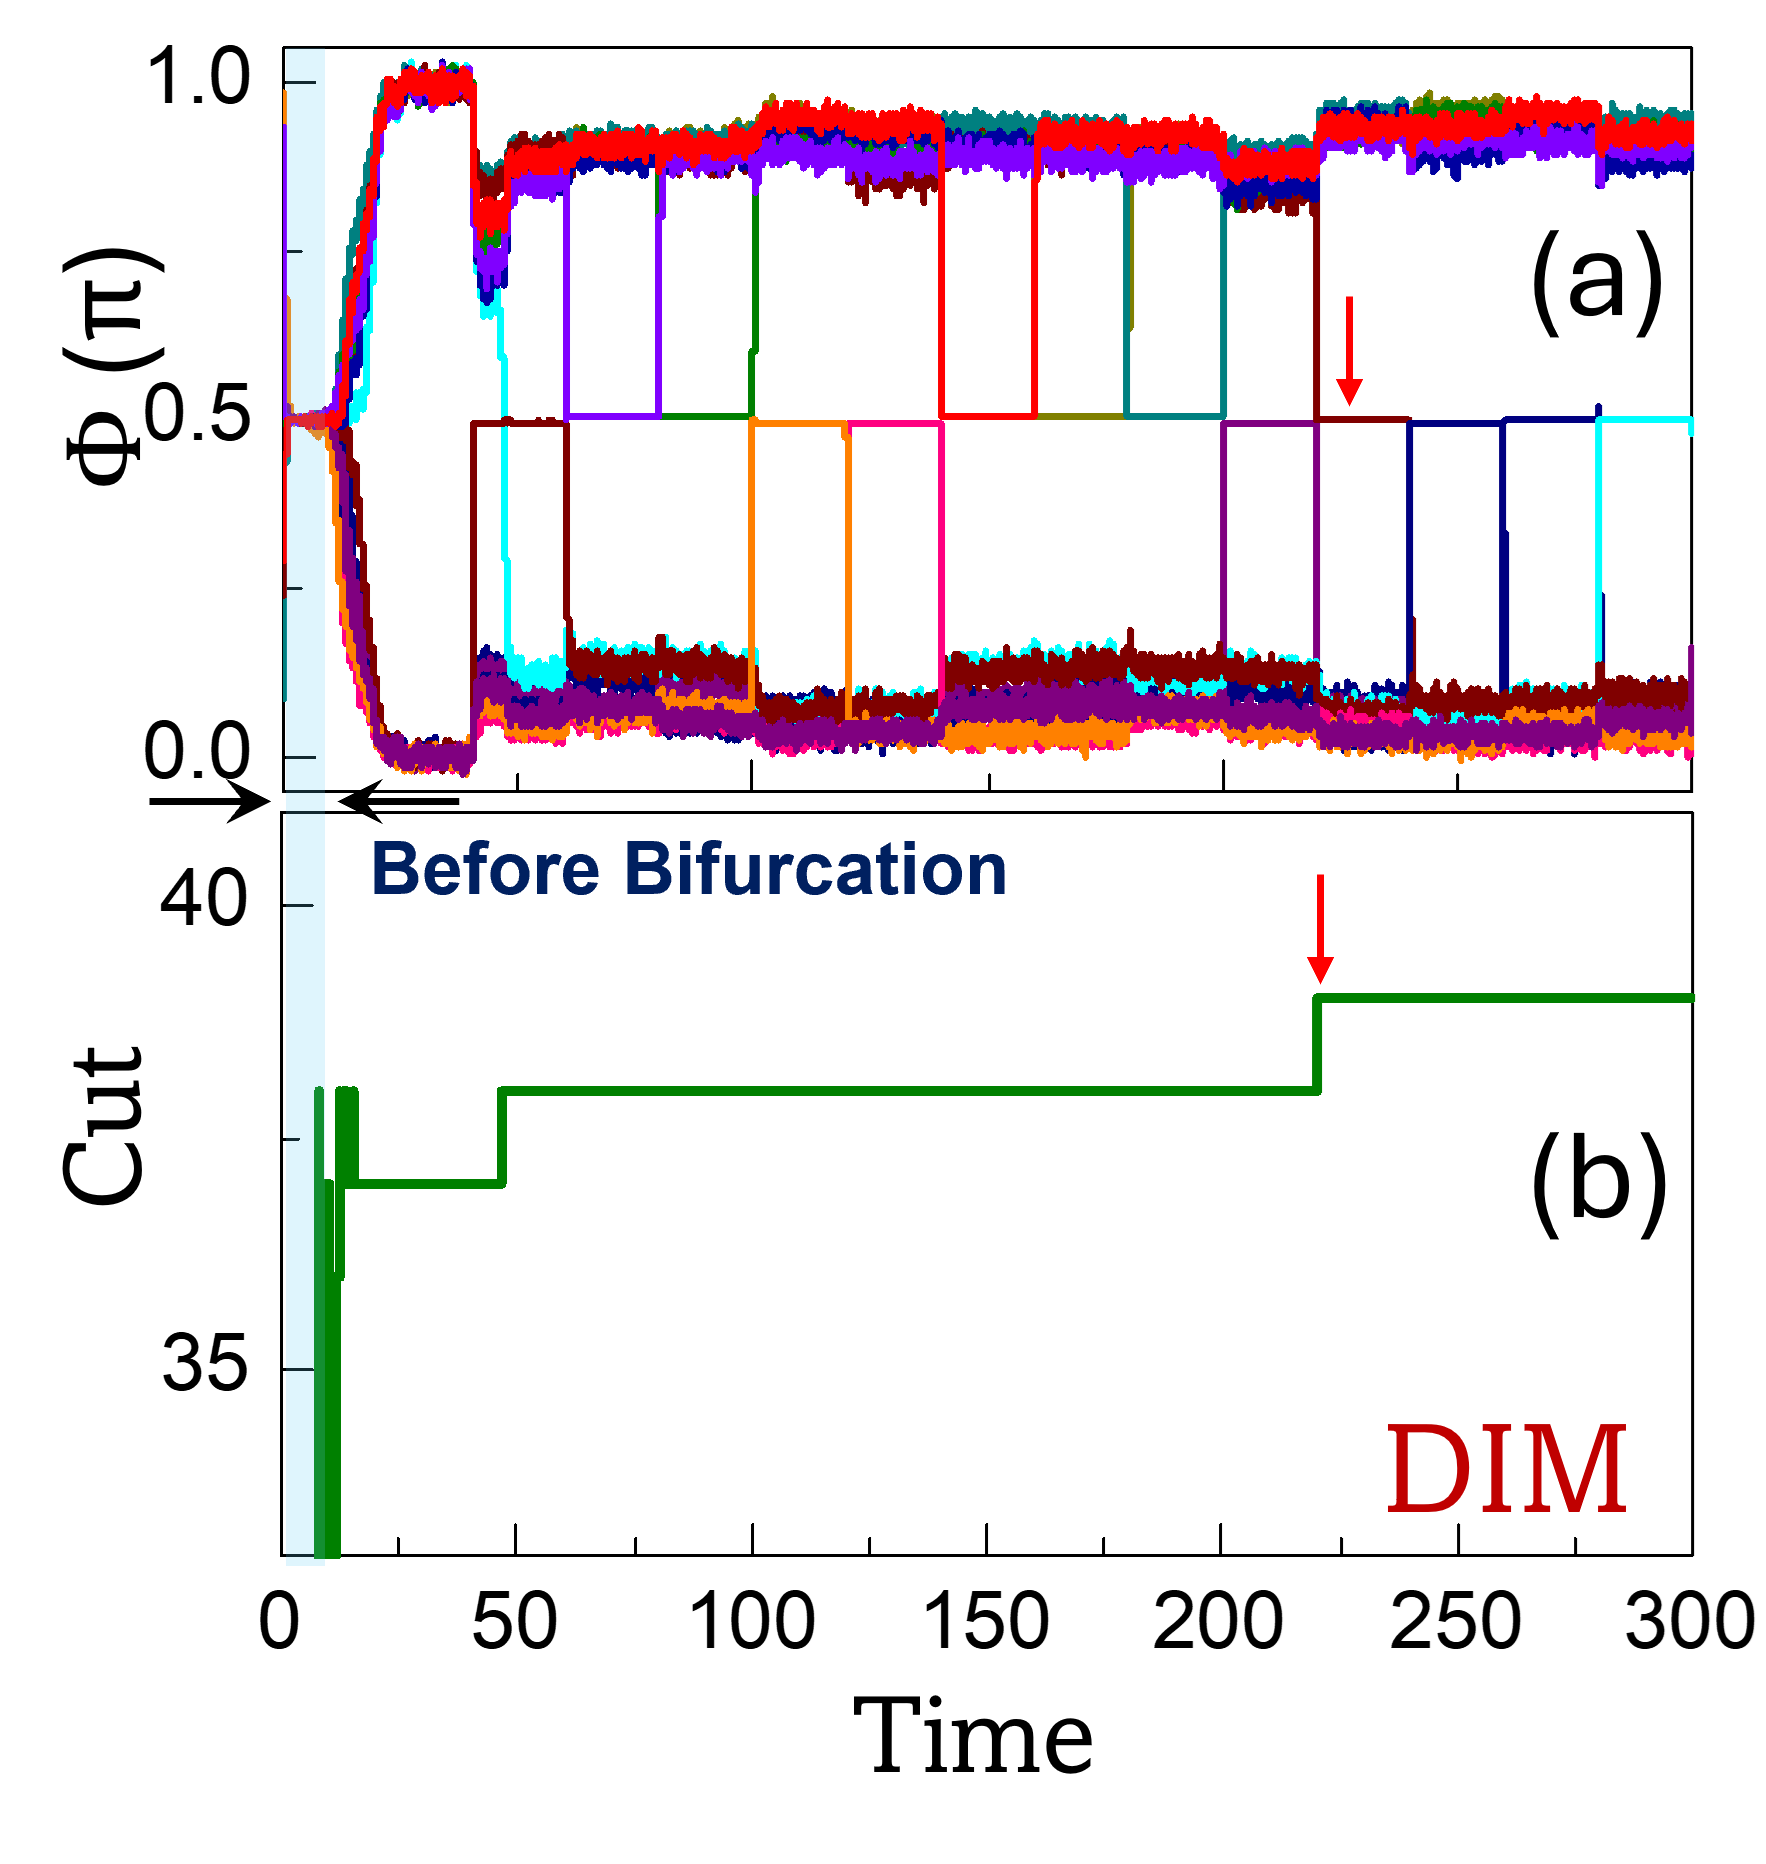
The image contains two panels:
- **(a)** A complex multi-line graph showing fluctuating values of Φ(π) over time, with sharp transitions and plateaus.
- **(b)** A step function graph depicting a binary "Cut" state over time, with a single drop and recovery.
### Components/Axes
#### Panel (a):
- **Y-axis**: Φ(π) (unitless, range: 0.0 to 1.0).
- **X-axis**: Time (range: 0 to 300).
- **Lines**: Multiple colored lines (red, blue, purple, orange, pink, teal) representing distinct data series.
- **Legend**: Located on the right, but colors do not match the lines (e.g., red in legend does not correspond to red lines).
- **Annotations**:
- Red arrow pointing to a sharp drop in Φ(π) around time 200.
- Text "Before Bifurcation" near the bottom left.
#### Panel (b):
- **Y-axis**: Cut (unitless, range: 35 to 40).
- **X-axis**: Time (range: 0 to 300).
- **Line**: Single green step function.
- **Annotations**:
- Red arrow pointing to a drop in "Cut" at time 10.
- Text "DIM" near the end of the graph.
### Detailed Analysis
#### Panel (a):
- **Trends**:
- All lines exhibit sharp transitions between plateaus (e.g., red line drops from ~0.8 to ~0.4 at time 200).
- Lines overlap significantly, with no clear separation between data series.
- Values oscillate between 0.0 and 1.0, with most lines clustering near 0.5–0.8.
- **Key Data Points**:
- Sharp drop in Φ(π) at time 200 (red arrow).
- Multiple plateaus (e.g., ~0.6–0.8 between 50–150, ~0.4–0.6 between 150–250).
#### Panel (b):
- **Trends**:
- "Cut" starts at 40, drops to 35 at time 10, remains constant until time 250, then jumps back to 40.
- **Key Data Points**:
- Drop at time 10 (red arrow).
- Recovery at time 250.
### Key Observations
1. **Panel (a)**:
- Multiple data series show synchronized fluctuations, suggesting correlated events.
- The red arrow highlights a critical drop in Φ(π) at time 200, potentially indicating a bifurcation event.
- Legend colors do not match lines, raising concerns about data integrity.
2. **Panel (b)**:
- Binary "Cut" state changes abruptly at time 10 and 250, possibly representing a threshold-based system.
- "DIM" annotation at time 250 may indicate a secondary event or state change.
### Interpretation
- **Panel (a)** likely represents a system with multiple interacting variables (e.g., physical, chemical, or biological processes) exhibiting chaotic or threshold-driven behavior. The sharp drop at time 200 could signify a bifurcation point where the system transitions to a new state.
- **Panel (b)** simplifies the system into a binary "Cut" state, which aligns with the drop in Φ(π) in Panel (a) at time 10. The "DIM" label at time 250 might correlate with the recovery in Panel (a), suggesting a delayed response or secondary effect.
- **Discrepancies**: The mismatched legend in Panel (a) implies potential errors in data labeling or visualization. Further validation of the legend is critical for accurate interpretation.
- **Relationship**: Both panels share the same time axis, implying temporal coupling. The "Before Bifurcation" text in Panel (a) suggests the data captures pre-critical behavior, with Panel (b) possibly representing a simplified proxy for the same phenomenon.