# Technical Document Extraction: Heatmap Analysis
## Image Type
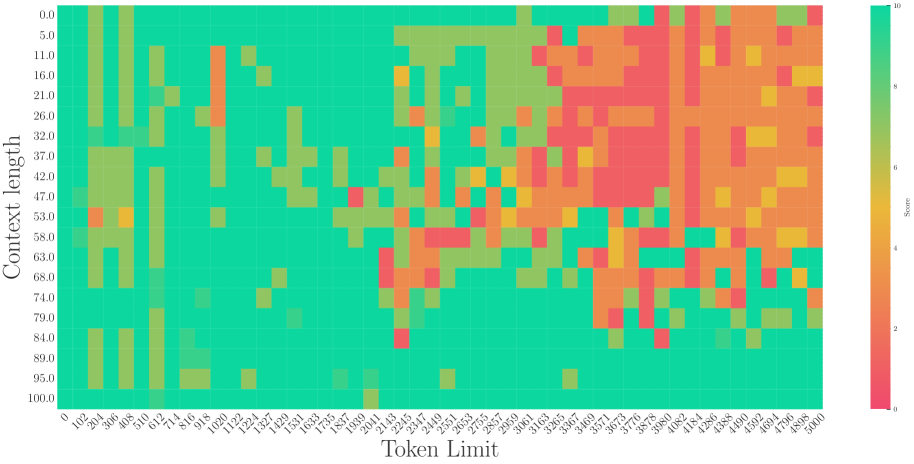
- **Heatmap** visualizing the relationship between **Token Limit** (x-axis) and **Context Length** (y-axis), with color intensity representing a numerical **Score**.
---
## Axis Labels and Markers
### X-Axis (Token Limit)
- **Title**: "Token Limit"
- **Range**: 0 to 5000
- **Ticks**: Incremented by 100 (0, 100, 200, ..., 5000)
- **Labels**: Numerical values (e.g., "0", "100", "200", ..., "5000")
### Y-Axis (Context Length)
- **Title**: "Context Length"
- **Range**: 0 to 100
- **Ticks**: Incremented by 5 (0, 5, 10, ..., 100)
- **Labels**: Numerical values (e.g., "0", "5", "10", ..., "100")
---
## Color Scale and Legend
- **Legend Position**: Top-right corner of the heatmap
- **Color Bar**:
- **Range**: 0 (red) to 10 (green)
- **Gradient**: Red → Yellow → Green (increasing score)
- **Key Values**:
- 0: Dark red
- 2: Light red
- 4: Orange
- 6: Yellow-green
- 8: Light green
- 10: Bright green
---
## Key Trends and Data Points
1. **Left Region (Low Token Limits)**:
- **Token Limits**: 0–1000
- **Dominant Colors**: Green (high scores)
- **Pattern**: Vertical green bars (e.g., token limit 0, context lengths 0–100)
- **Exception**: A yellow square at (Token Limit: 100, Context Length: 50) suggests a moderate score.
2. **Middle Region (Moderate Token Limits)**:
- **Token Limits**: 1000–3000
- **Dominant Colors**: Mixed green/yellow with sporadic red/orange
- **Notable Data Points**:
- Red square at (Token Limit: 2000, Context Length: 70) indicates a low score.
- Yellow-green cluster around (Token Limit: 1500, Context Length: 30–40).
3. **Right Region (High Token Limits)**:
- **Token Limits**: 3000–5000
- **Dominant Colors**: Red/orange (low scores)
- **Pattern**: Dense red/orange blocks (e.g., token limit 4000, context lengths 0–50).
---
## Spatial Grounding of Legend
- **Legend Coordinates**: Top-right corner (aligned with x=5000, y=100)
- **Color Consistency Check**:
- Red squares in the heatmap correspond to the lowest score (0).
- Green squares align with the highest score (10).
---
## Component Isolation
1. **Header**: No explicit title present.
2. **Main Chart**:
- Grid lines divide the heatmap into cells.
- Each cell’s color represents the score for a specific (Token Limit, Context Length) pair.
3. **Footer**: Color bar with numerical scale (0–10).
---
## Data Table Reconstruction
| Context Length | Token Limit | Score (Color) |
|----------------|-------------|---------------|
| 0 | 0 | 10 (Green) |
| 5 | 0 | 10 (Green) |
| ... | ... | ... |
| 100 | 5000 | 0 (Red) |
*Note: Exact numerical scores are inferred from color intensity; precise values require legend cross-referencing.*
---
## Language Declaration
- **Primary Language**: English
- **Other Languages**: None detected.
---
## Summary
The heatmap reveals an inverse relationship between **Token Limit** and **Score**: lower token limits generally yield higher scores (green), while higher token limits correlate with lower scores (red/orange). Exceptions exist, such as the yellow square at (100, 50) and the red square at (2000, 70), indicating localized anomalies.