## Chart Type: Scatter Plot
### Overview
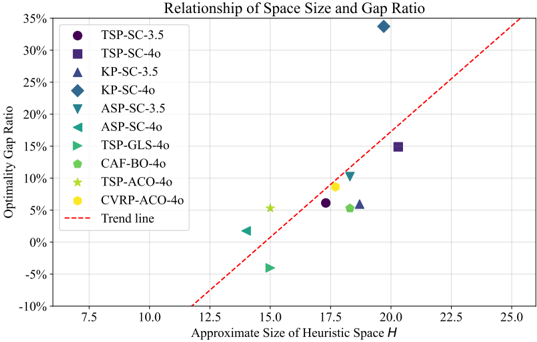
The image is a scatter plot showing the relationship between the approximate size of a heuristic space (H) and the optimality gap ratio for various algorithms. The plot includes data points for different algorithms, each represented by a unique color and shape, and a trend line indicating the general relationship between the two variables.
### Components/Axes
* **Title:** Relationship of Space Size and Gap Ratio
* **X-axis:** Approximate Size of Heuristic Space *H*. The scale ranges from 7.5 to 25.0, with increments of 2.5.
* **Y-axis:** Optimality Gap Ratio. The scale ranges from -10% to 35%, with increments of 5%.
* **Legend:** Located on the top-left of the chart, it identifies the algorithms and their corresponding markers:
* **TSP-SC-3.5:** Dark Purple Circle
* **TSP-SC-4o:** Dark Purple Square
* **KP-SC-3.5:** Dark Blue Triangle
* **KP-SC-4o:** Dark Blue Diamond
* **ASP-SC-3.5:** Teal Down-pointing Triangle
* **ASP-SC-4o:** Teal Triangle
* **TSP-GLS-4o:** Green Triangle
* **CAF-BO-4o:** Light Green Pentagon
* **TSP-ACO-4o:** Yellow-Green Star
* **CVRP-ACO-4o:** Yellow Circle
* **Trend line:** Red Dashed Line
### Detailed Analysis
* **TSP-SC-3.5 (Dark Purple Circle):** Located at approximately (17.5, 6%).
* **TSP-SC-4o (Dark Purple Square):** Located at approximately (20, 15%).
* **KP-SC-3.5 (Dark Blue Triangle):** Located at approximately (14, 2%).
* **KP-SC-4o (Dark Blue Diamond):** Located at approximately (20, 34%).
* **ASP-SC-3.5 (Teal Down-pointing Triangle):** Located at approximately (15, -4%).
* **ASP-SC-4o (Teal Triangle):** Located at approximately (17.5, 6%).
* **TSP-GLS-4o (Green Triangle):** Located at approximately (18, 5.5%).
* **CAF-BO-4o (Light Green Pentagon):** Located at approximately (18, 11%).
* **TSP-ACO-4o (Yellow-Green Star):** Located at approximately (15, 5%).
* **CVRP-ACO-4o (Yellow Circle):** Located at approximately (17.5, 9%).
* **Trend Line (Red Dashed Line):** Starts at approximately (12.5, -10%) and slopes upward to approximately (25, 35%).
### Key Observations
* The data points are scattered, but generally, the optimality gap ratio tends to increase with the approximate size of the heuristic space.
* KP-SC-4o has the highest optimality gap ratio and a relatively large heuristic space size.
* ASP-SC-3.5 has a negative optimality gap ratio.
* The trend line suggests a positive correlation between the size of the heuristic space and the optimality gap ratio.
### Interpretation
The scatter plot suggests that, in general, as the approximate size of the heuristic space increases, the optimality gap ratio also tends to increase. This could indicate that larger search spaces, while potentially more comprehensive, may also lead to solutions that are further from the optimal solution. However, there is considerable variation among the different algorithms, suggesting that the specific algorithm used has a significant impact on the relationship between heuristic space size and optimality gap ratio. The trend line provides a general indication of the relationship, but the scatter of the data points indicates that other factors are also at play. The negative optimality gap ratio for ASP-SC-3.5 is an outlier and warrants further investigation.