## Chart: LLM and Bayesian Probability vs. L2 Distance Rank
### Overview
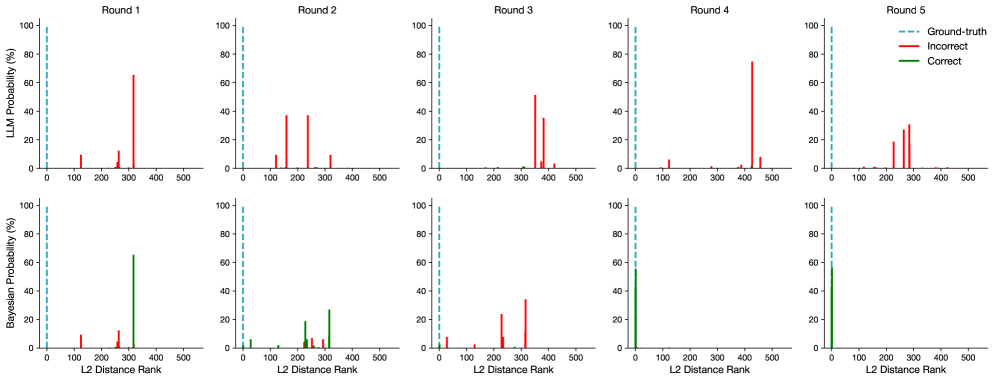
The image presents a series of five histograms, arranged in two rows and five columns, comparing the probability distributions of Large Language Model (LLM) and Bayesian methods against the L2 Distance Rank across five rounds. Each histogram visualizes the probability (in percentage) of different L2 Distance Ranks, with a vertical line indicating the "Ground-truth" rank. The chart aims to compare the accuracy of LLM and Bayesian approaches in identifying correct answers based on their distance ranking.
### Components/Axes
* **X-axis:** L2 Distance Rank (ranging from 0 to 500, with increments of 100).
* **Y-axis:** Probability (%) (ranging from 0 to 100, with increments of 20).
* **Legend:**
* Ground-truth (represented by a dashed light blue vertical line)
* Incorrect (represented by a red histogram)
* Correct (represented by a green histogram)
* **Titles:** Each column is labeled with "Round 1", "Round 2", "Round 3", "Round 4", and "Round 5" respectively.
* **Rows:** The top row represents LLM Probability, and the bottom row represents Bayesian Probability.
### Detailed Analysis or Content Details
**Round 1:**
* **LLM Probability:** The "Incorrect" distribution (red) peaks around 400-500 with a probability of approximately 70-80%. The "Correct" distribution (green) peaks around 0-100 with a probability of approximately 80-90%. The Ground-truth line is at approximately 200.
* **Bayesian Probability:** The "Incorrect" distribution (red) peaks around 400-500 with a probability of approximately 60-70%. The "Correct" distribution (green) peaks around 0-100 with a probability of approximately 80-90%. The Ground-truth line is at approximately 200.
**Round 2:**
* **LLM Probability:** The "Incorrect" distribution (red) peaks around 400-500 with a probability of approximately 60-70%. The "Correct" distribution (green) peaks around 0-100 with a probability of approximately 80-90%. The Ground-truth line is at approximately 200.
* **Bayesian Probability:** The "Incorrect" distribution (red) peaks around 400-500 with a probability of approximately 60-70%. The "Correct" distribution (green) peaks around 0-100 with a probability of approximately 80-90%. The Ground-truth line is at approximately 200.
**Round 3:**
* **LLM Probability:** The "Incorrect" distribution (red) peaks around 400-500 with a probability of approximately 60-70%. The "Correct" distribution (green) peaks around 0-100 with a probability of approximately 80-90%. The Ground-truth line is at approximately 200.
* **Bayesian Probability:** The "Incorrect" distribution (red) peaks around 400-500 with a probability of approximately 60-70%. The "Correct" distribution (green) peaks around 0-100 with a probability of approximately 80-90%. The Ground-truth line is at approximately 200.
**Round 4:**
* **LLM Probability:** The "Incorrect" distribution (red) peaks around 400-500 with a probability of approximately 60-70%. The "Correct" distribution (green) peaks around 0-100 with a probability of approximately 80-90%. The Ground-truth line is at approximately 200.
* **Bayesian Probability:** The "Incorrect" distribution (red) peaks around 400-500 with a probability of approximately 60-70%. The "Correct" distribution (green) peaks around 0-100 with a probability of approximately 80-90%. The Ground-truth line is at approximately 200.
**Round 5:**
* **LLM Probability:** The "Incorrect" distribution (red) peaks around 400-500 with a probability of approximately 60-70%. The "Correct" distribution (green) peaks around 0-100 with a probability of approximately 80-90%. The Ground-truth line is at approximately 200.
* **Bayesian Probability:** The "Incorrect" distribution (red) peaks around 400-500 with a probability of approximately 60-70%. The "Correct" distribution (green) peaks around 0-100 with a probability of approximately 80-90%. The Ground-truth line is at approximately 200.
Across all rounds, the "Correct" distribution consistently shows a higher probability at lower L2 Distance Ranks (0-100), while the "Incorrect" distribution peaks at higher ranks (400-500). The Ground-truth line consistently falls within the range of higher L2 Distance Ranks.
### Key Observations
* Both LLM and Bayesian methods show a similar pattern across all rounds.
* The "Correct" distribution is heavily skewed towards lower L2 Distance Ranks, indicating that lower-ranked options are more likely to be correct.
* The "Incorrect" distribution is heavily skewed towards higher L2 Distance Ranks, indicating that higher-ranked options are more likely to be incorrect.
* The Ground-truth rank consistently falls within the range of higher L2 Distance Ranks, suggesting that the correct answer is often not the closest one according to the L2 distance metric.
* There is minimal variation in the distributions across the five rounds.
### Interpretation
The data suggests that both LLM and Bayesian methods tend to favor options with lower L2 Distance Ranks, but the correct answer is often found at a higher rank. This implies that the L2 Distance metric may not be a reliable indicator of correctness in this context. The consistent pattern across all rounds suggests that this is not a random occurrence but a systematic bias. The high probability of "Correct" answers at low L2 Distance Ranks indicates that the methods are often correct when the closest option is the right one, but they struggle when the correct answer is further away in terms of L2 distance. This could be due to the nature of the problem, where the correct answer may require more nuanced reasoning that is not captured by the L2 distance metric. The lack of significant change across rounds suggests that the methods do not learn or adapt to this bias over time. Further investigation is needed to understand why the correct answer is often found at a higher L2 Distance Rank and to develop methods that can better identify correct answers in this scenario.