## Bar Charts: LLM and Bayesian Probability by Round and L2 Distance Rank
### Overview
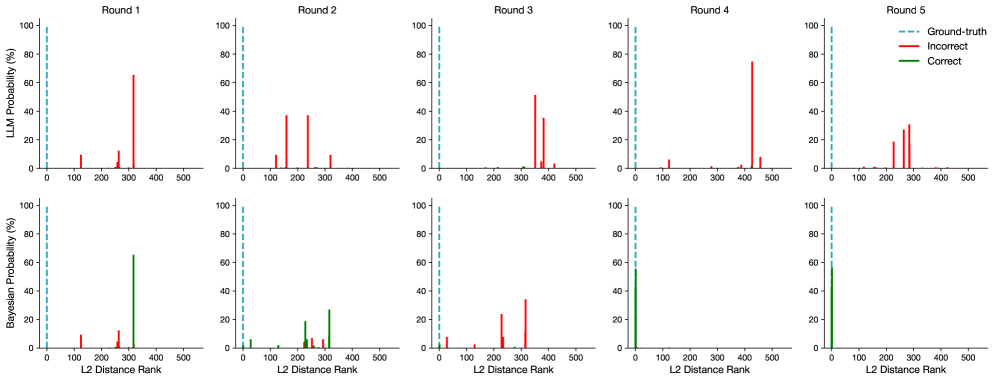
The image contains 10 bar charts (2 per round across 5 rounds) comparing **LLM Probability** and **Bayesian Probability** distributions across L2 Distance Ranks. Each chart includes a **Ground-truth** (blue dashed line at x=0), **Incorrect** (red bars), and **Correct** (green bars) categories. The x-axis represents L2 Distance Rank (0–500), and the y-axis represents probability percentage (0–100%).
---
### Components/Axes
- **X-axis**: L2 Distance Rank (0–500, linear scale).
- **Y-axis**: Probability (%) (0–100%, linear scale).
- **Legends**:
- **Ground-truth**: Blue dashed vertical line at x=0 (100% probability).
- **Incorrect**: Red bars.
- **Correct**: Green bars.
- **Chart Titles**: "Round X" (X = 1–5) for each pair of charts.
---
### Detailed Analysis
#### Round 1
- **LLM Probability**:
- Ground-truth: 100% at x=0.
- Incorrect: ~65% at x≈650.
- Correct: ~50% at x≈500.
- **Bayesian Probability**:
- Ground-truth: 100% at x=0.
- Incorrect: ~10% at x≈100.
- Correct: ~30% at x≈300.
#### Round 2
- **LLM Probability**:
- Ground-truth: 100% at x=0.
- Incorrect: ~40% at x≈200, ~30% at x≈300.
- Correct: ~20% at x≈400.
- **Bayesian Probability**:
- Ground-truth: 100% at x=0.
- Incorrect: ~5% at x≈100, ~10% at x≈200.
- Correct: ~20% at x≈300, ~15% at x≈400.
#### Round 3
- **LLM Probability**:
- Ground-truth: 100% at x=0.
- Incorrect: ~50% at x≈400.
- Correct: ~30% at x≈300.
- **Bayesian Probability**:
- Ground-truth: 100% at x=0.
- Incorrect: ~20% at x≈200.
- Correct: ~40% at x≈300.
#### Round 4
- **LLM Probability**:
- Ground-truth: 100% at x=0.
- Incorrect: ~75% at x≈450.
- Correct: ~10% at x≈400.
- **Bayesian Probability**:
- Ground-truth: 100% at x=0.
- Incorrect: ~30% at x≈300.
- Correct: ~50% at x≈400.
#### Round 5
- **LLM Probability**:
- Ground-truth: 100% at x=0.
- Incorrect: ~30% at x≈200, ~25% at x≈300.
- Correct: ~15% at x≈400.
- **Bayesian Probability**:
- Ground-truth: 100% at x=0.
- Incorrect: ~20% at x≈200.
- Correct: ~60% at x≈400.
---
### Key Observations
1. **Ground-truth Consistency**: The blue dashed line at x=0 (100%) appears in all charts, indicating the true answer’s position.
2. **LLM vs. Bayesian Performance**:
- **LLM Probability**: Incorrect answers often dominate (e.g., Round 1: 65% vs. 50% Correct).
- **Bayesian Probability**: Correct answers sometimes outperform Incorrect (e.g., Round 5: 60% vs. 20%).
3. **L2 Distance Trends**:
- Higher L2 ranks (x-axis) correlate with lower probabilities for both models.
- Bayesian models show sharper peaks for Correct answers (e.g., Round 5: 60% at x=400).
---
### Interpretation
- **LLM Limitations**: The models struggle to distinguish Correct answers from Incorrect ones in many rounds, with Incorrect probabilities frequently exceeding Correct (e.g., Round 1, 4).
- **Bayesian Advantage**: Bayesian models better isolate Correct answers in later rounds (e.g., Round 5: 60% Correct vs. 20% Incorrect), suggesting improved calibration or confidence estimation.
- **Ground-truth Anchoring**: The consistent placement of the Ground-truth at x=0 implies the true answer is always the closest in L2 distance, but models fail to prioritize it reliably.
---
### Spatial Grounding & Verification
- **Legend Placement**: Top-right corner of all charts, ensuring clear association with bar colors.
- **Color Consistency**: Red (Incorrect) and green (Correct) bars match legend labels across all rounds.
- **Trend Verification**: For example, in Round 4 LLM Probability, the red bar at x=450 (75%) is visually taller than the green bar at x=400 (10%), confirming the data.
---
### Conclusion
The data highlights a critical gap in LLM performance: Incorrect answers often receive higher probabilities than Correct ones, even when the Ground-truth is unambiguous. Bayesian models show promise in later rounds but still lag in early stages. This suggests opportunities to refine model calibration or incorporate Bayesian uncertainty estimation for better reliability.