## Radar Charts & Bar Chart: Performance Comparison of Models on PKU Exams
### Overview
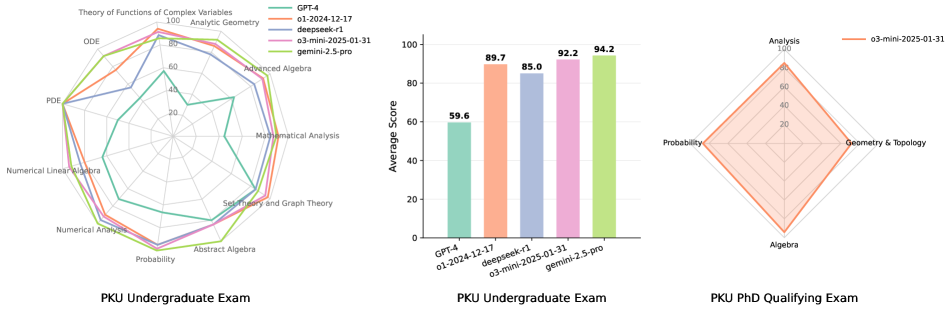
The image presents a comparison of the performance of several language models (GPT-4, 01-2024-12-17, deepseek-r1, 03-mini-2025-01-31, and gemini-2.5-pro) on three different PKU (Peking University) exams: Undergraduate Exam, Undergraduate Exam (Bar Chart), and PhD Qualifying Exam. The undergraduate exams are visualized using radar charts, while the bar chart displays average scores for the undergraduate exam. The PhD exam is also visualized using a radar chart.
### Components/Axes
* **Radar Charts (Undergraduate & PhD):**
* Axes represent different mathematical subjects: Theory of Functions of Complex Variables, Analytic Geometry, Advanced Algebra, Mathematical Analysis, Set Theory and Graph Theory, Abstract Algebra, Numerical Analysis, Probability, PDE, ODE, Geometry & Topology, Analysis.
* Scale ranges from 0 to 100.
* **Bar Chart (Undergraduate):**
* X-axis: Model names (GPT-4, 01-2024-12-17, deepseek-r1, 03-mini-2025-01-31, gemini-2.5-pro).
* Y-axis: Average Score (0 to 100).
* **Legend (Top-Right):**
* GPT-4 (Green)
* 01-2024-12-17 (Light Green)
* deepseek-r1 (Purple)
* 03-mini-2025-01-31 (Pink)
* gemini-2.5-pro (Orange)
### Detailed Analysis or Content Details
**1. PKU Undergraduate Exam (Radar Chart):**
* **GPT-4 (Green):** Shows relatively consistent performance across all subjects, with slightly higher scores in Theory of Functions of Complex Variables, Analytic Geometry, and Advanced Algebra (approximately 80-90). Lowest score in Probability (around 50).
* **01-2024-12-17 (Light Green):** Similar to GPT-4, but generally lower scores across all subjects. Highest in Analytic Geometry (around 70), lowest in Probability (around 30).
* **deepseek-r1 (Purple):** Performance is variable. High in Analytic Geometry (around 80), but lower in other areas, particularly Probability (around 20).
* **03-mini-2025-01-31 (Pink):** Generally lower scores than GPT-4, with a peak in Analytic Geometry (around 70) and a low in Probability (around 20).
* **gemini-2.5-pro (Orange):** Lowest overall performance. Scores are consistently below 50 across all subjects, with a minimum in Probability (around 10).
**2. PKU Undergraduate Exam (Bar Chart):**
* **GPT-4:** 59.6
* **01-2024-12-17:** 89.7
* **deepseek-r1:** 85.0
* **03-mini-2025-01-31:** 92.2
* **gemini-2.5-pro:** 94.2
**3. PKU PhD Qualifying Exam (Radar Chart):**
* **03-mini-2025-01-31 (Pink):** Shows relatively consistent performance across all subjects, with slightly higher scores in Analysis and Geometry & Topology (approximately 70-80). Lowest score in Algebra (around 40).
### Key Observations
* The bar chart for the undergraduate exam shows that gemini-2.5-pro and 03-mini-2025-01-31 significantly outperform GPT-4, 01-2024-12-17, and deepseek-r1.
* The radar charts reveal that Probability is a consistently weak area for most models, especially gemini-2.5-pro and deepseek-r1.
* Analytic Geometry appears to be a relatively strong area for several models.
* There is a discrepancy between the radar chart and bar chart for the undergraduate exam. The radar chart suggests GPT-4 performs better than the bar chart indicates. This could be due to the radar chart showing performance across multiple subjects, while the bar chart represents an average score.
* The PhD exam radar chart only shows performance for 03-mini-2025-01-31.
### Interpretation
The data suggests that gemini-2.5-pro and 03-mini-2025-01-31 are the strongest performing models on the PKU undergraduate exam, based on the average scores. However, the radar charts provide a more nuanced view, revealing strengths and weaknesses in specific mathematical subjects. The consistent weakness in Probability across most models suggests this is a challenging area for these language models. The PhD qualifying exam data, limited to 03-mini-2025-01-31, indicates a reasonable level of performance, but further comparison with other models is needed. The discrepancy between the radar chart and bar chart for the undergraduate exam highlights the importance of considering multiple evaluation metrics and visualizations to gain a comprehensive understanding of model performance. The lack of data for other models on the PhD exam limits the ability to draw definitive conclusions about their performance at that level.