\n
## Diagram: Math Proof Strategies
### Overview
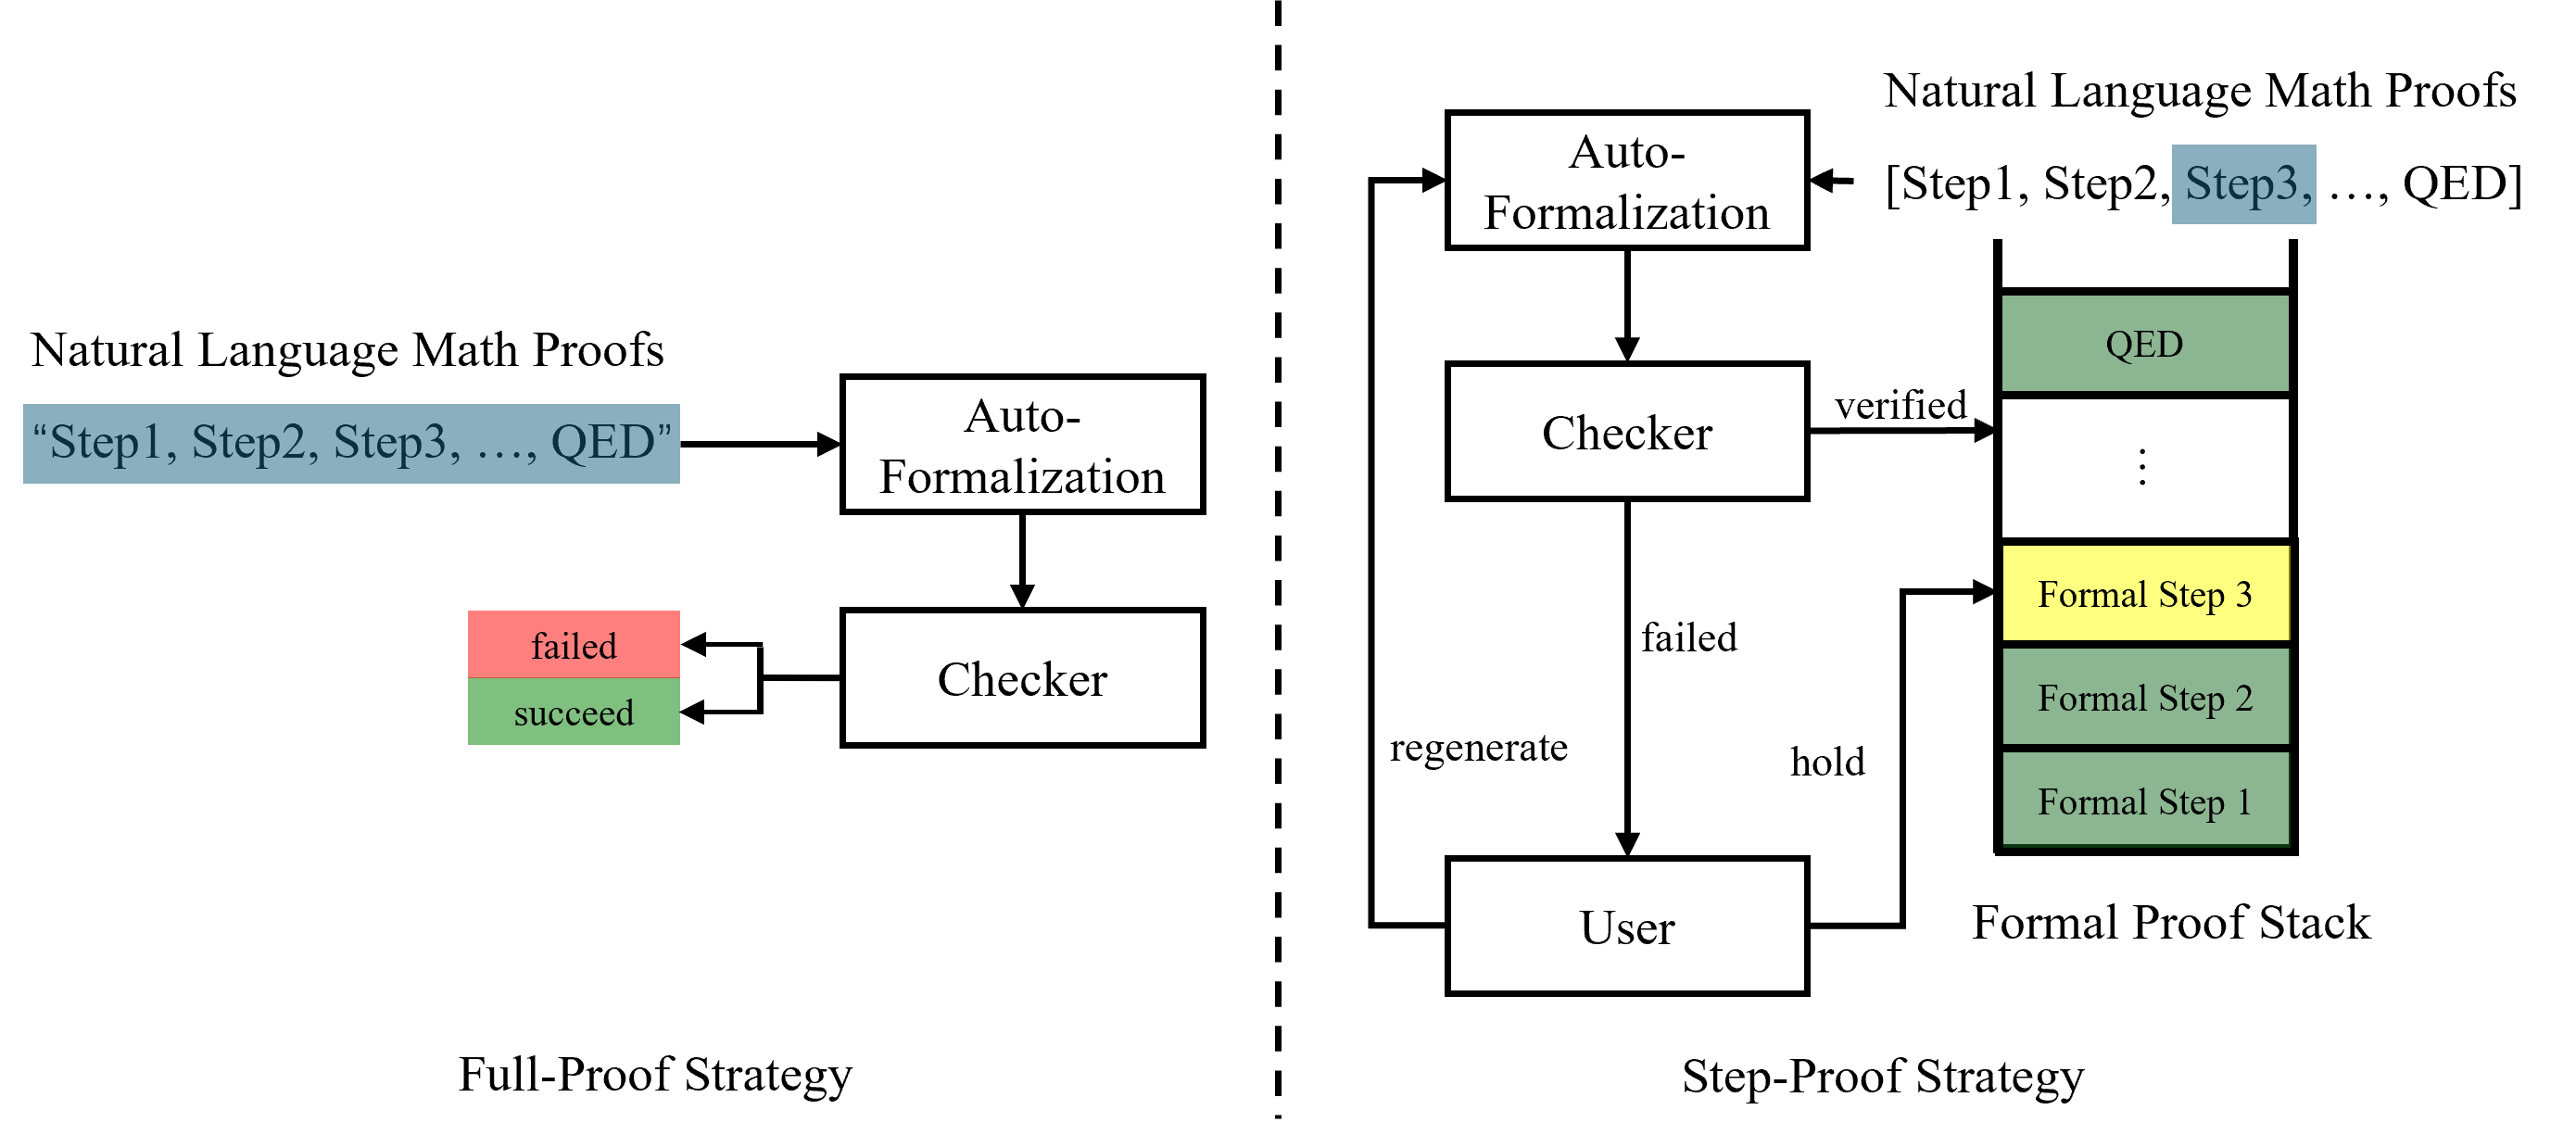
This diagram illustrates two strategies for verifying mathematical proofs: a "Full-Proof Strategy" and a "Step-Proof Strategy". It depicts the flow of a natural language math proof through auto-formalization and checking processes, with feedback loops for refinement.
### Components/Axes
The diagram consists of several key components:
* **Natural Language Math Proofs:** Represented as text strings like "Step1, Step2, Step3, ..., QED".
* **Auto-Formalization:** A process that converts natural language proofs into a formal representation.
* **Checker:** A component that verifies the correctness of the formalized proof.
* **User:** Represents human interaction in the Step-Proof Strategy.
* **Formal Proof Stack:** A stack of formalized steps in the Step-Proof Strategy.
* **Arrows:** Indicate the flow of information and control between components.
* **Labels:** "Full-Proof Strategy", "Step-Proof Strategy", "regenerate", "hold", "succeed", "failed", "verified".
### Detailed Analysis or Content Details
**Full-Proof Strategy (Left Side):**
1. A "Natural Language Math Proofs" input (text: "Step1, Step2, Step3, ..., QED") is fed into "Auto-Formalization".
2. The output of "Auto-Formalization" is sent to "Checker".
3. The "Checker" has two possible outputs:
* "succeed" (green arrow) – indicating the proof is valid.
* "failed" (red arrow) – indicating the proof is invalid, looping back to "Auto-Formalization".
**Step-Proof Strategy (Right Side):**
1. A "Natural Language Math Proofs" input (text: "[Step1, Step2, Step3, ..., QED]") is fed into "Auto-Formalization".
2. The output of "Auto-Formalization" is sent to "Checker".
3. The "Checker" has two possible outputs:
* "verified" (green arrow) – indicating the step is valid, adding it to the "Formal Proof Stack". The stack contains "QED", "Formal Step 3", "Formal Step 2", and "Formal Step 1" (from top to bottom).
* "failed" (red arrow) – indicating the step is invalid, sending a "regenerate" signal to the "User".
4. The "User" can either "hold" the current state or "regenerate" a new step, sending it back to "Auto-Formalization".
A dashed vertical line separates the two strategies.
### Key Observations
* The Full-Proof Strategy is a closed loop, attempting to formalize and check the entire proof at once.
* The Step-Proof Strategy is iterative, building a formal proof step-by-step with user interaction.
* The "Checker" is central to both strategies, providing validation.
* The "User" is only involved in the Step-Proof Strategy, suggesting a more interactive process.
* The Formal Proof Stack is built from the top down, with "QED" at the top and "Formal Step 1" at the bottom.
### Interpretation
The diagram contrasts two approaches to automated theorem proving. The Full-Proof Strategy represents a "one-shot" attempt to verify a complete proof, while the Step-Proof Strategy allows for incremental verification and user correction. The Step-Proof Strategy is likely more robust to errors, as it allows for early detection and correction of issues. The diagram highlights the role of the "Checker" as a critical component in both strategies, and the importance of user interaction in the Step-Proof Strategy for refining the proof. The dashed line visually separates the two strategies, emphasizing their distinct workflows. The diagram suggests a trade-off between automation (Full-Proof) and control/correctness (Step-Proof).