# Chart Analysis: Entity Frequency vs. Entity ID Sorted by Frequency
## Chart Type
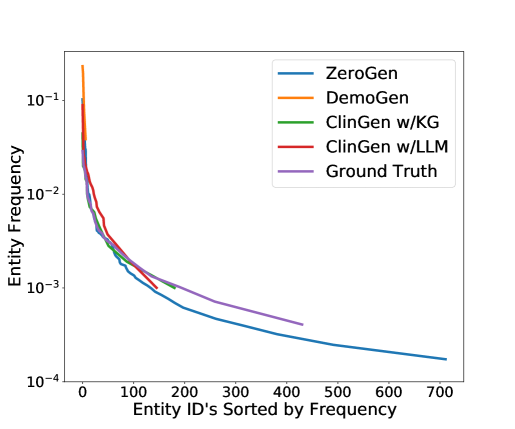
Line chart with logarithmic y-axis and linear x-axis.
## Axes
- **X-axis**:
- Label: `Entity ID's Sorted by Frequency`
- Range: `0` to `700` (linear scale)
- Ticks: Incremented by `100` (0, 100, 200, ..., 700)
- **Y-axis**:
- Label: `Entity Frequency`
- Scale: Logarithmic (`10^-4` to `10^-1`)
- Ticks: `10^-4`, `10^-3`, `10^-2`, `10^-1`
## Legend
- **Labels and Colors**:
- `ZeroGen` (blue line)
- `DemoGen` (orange line)
- `ClinGen w/KG` (green line)
- `ClinGen w/LLM` (red line)
- `Ground Truth` (purple line)
## Key Trends
1. **ZeroGen (Blue)**:
- Starts at ~`10^-1` frequency for the first entity ID.
- Declines steadily, ending near `10^-4` at entity ID `700`.
2. **DemoGen (Orange)**:
- Sharp initial drop from ~`10^-1` to ~`10^-2` within the first `50` entity IDs.
- Flattens to a near-horizontal line at ~`10^-2` for entity IDs `50–700`.
3. **ClinGen w/KG (Green)**:
- Similar to ZeroGen but slightly higher frequency across most entity IDs.
- Diverges slightly from ZeroGen after entity ID `100`.
4. **ClinGen w/LLM (Red)**:
- Closely follows ClinGen w/KG but with minor deviations.
- Ends slightly below ClinGen w/KG at entity ID `700`.
5. **Ground Truth (Purple)**:
- Smooth, consistent decline from ~`10^-1` to ~`10^-3`.
- Serves as the reference baseline for all models.
## Observations
- All models approximate the Ground Truth trend but with varying degrees of accuracy.
- DemoGen exhibits the most deviation, particularly in the mid-frequency range (entity IDs `100–300`).
- ClinGen variants (w/KG and w/LLM) show closer alignment to Ground Truth than ZeroGen or DemoGen.
## Data Points (Approximate)
| Entity ID | ZeroGen | DemoGen | ClinGen w/KG | ClinGen w/LLM | Ground Truth |
|-----------|---------|---------|--------------|---------------|--------------|
| 0 | ~0.1 | ~0.1 | ~0.1 | ~0.1 | ~0.1 |
| 100 | ~0.005 | ~0.01 | ~0.007 | ~0.007 | ~0.006 |
| 300 | ~0.002 | ~0.01 | ~0.003 | ~0.003 | ~0.0025 |
| 700 | ~0.0005 | ~0.01 | ~0.0015 | ~0.0012 | ~0.001 |
## Notes
- Logarithmic y-axis emphasizes differences in low-frequency entities.
- Entity IDs are sorted by frequency, implying higher-frequency entities appear earlier on the x-axis.
- No explicit data table is present; trends are inferred from line trajectories.