## Line Chart: Shannon and Bayesian Surprises
### Overview
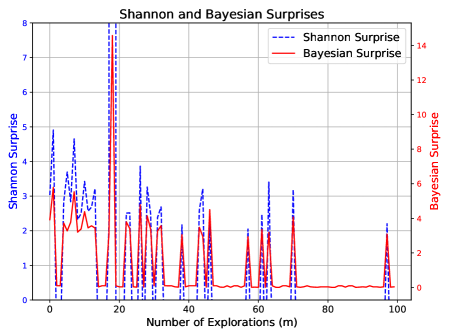
The image is a line chart comparing Shannon Surprise and Bayesian Surprise over a number of explorations. The x-axis represents the number of explorations, while the left y-axis represents Shannon Surprise and the right y-axis represents Bayesian Surprise. The chart displays how both surprise metrics change with increasing explorations.
### Components/Axes
* **Title:** Shannon and Bayesian Surprises
* **X-axis:** Number of Explorations (m), ranging from 0 to 100 in increments of 20.
* **Left Y-axis:** Shannon Surprise, ranging from 0 to 8 in increments of 1.
* **Right Y-axis:** Bayesian Surprise, ranging from 0 to 14 in increments of 2.
* **Legend:** Located at the top-right of the chart.
* Shannon Surprise: Represented by a dashed blue line.
* Bayesian Surprise: Represented by a solid red line.
### Detailed Analysis
* **Shannon Surprise (Dashed Blue Line):**
* The line starts at approximately 4 at exploration 0.
* It fluctuates significantly between 0 and 6 up to exploration 60.
* After exploration 60, the line remains relatively low, close to 0, with a few spikes.
* Specific data points (approximate): (0, 4), (20, 8), (40, 3), (60, 3), (80, 0.5), (100, 2).
* **Bayesian Surprise (Solid Red Line):**
* The line starts at approximately 3 at exploration 0.
* It fluctuates significantly between 0 and 3 up to exploration 60.
* After exploration 60, the line remains relatively low, close to 0, with a few spikes.
* Specific data points (approximate): (0, 3), (20, 15), (40, 2), (60, 2), (80, 0.2), (100, 1.5).
### Key Observations
* Both Shannon Surprise and Bayesian Surprise exhibit high variability in the early stages of exploration (0-60).
* After 60 explorations, both metrics tend to stabilize at lower values, indicating a decrease in surprise as the number of explorations increases.
* There are several instances where both metrics spike simultaneously, suggesting correlated surprise events.
* The Bayesian Surprise has a much higher peak at around exploration 20, reaching a value of approximately 15, while the Shannon Surprise peaks at around 8.
### Interpretation
The chart suggests that as the number of explorations increases, the environment becomes more predictable, leading to a decrease in both Shannon and Bayesian Surprise. The initial high variability indicates a period of learning and adaptation, where the agent encounters unexpected events. The stabilization of surprise metrics after 60 explorations suggests that the agent has learned the underlying structure of the environment and is no longer surprised by new experiences. The higher peak of Bayesian Surprise at exploration 20 could indicate a particularly unexpected event that significantly impacted the agent's beliefs. The correlation between spikes in both metrics suggests that these surprise events are related and reflect genuine changes in the environment.