## Line Chart: Shannon and Bayesian Surprises
### Overview
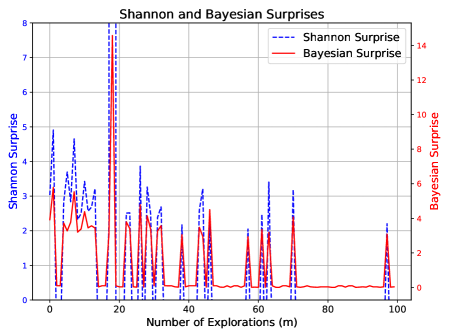
The image presents a line chart comparing Shannon Surprise and Bayesian Surprise over a number of explorations (m). The chart displays the fluctuations of both surprise metrics as the number of explorations increases from 0 to 100. The chart has a grid background for easier readability.
### Components/Axes
* **Title:** "Shannon and Bayesian Surprises" - positioned at the top-center of the chart.
* **X-axis:** "Number of Explorations (m)" - ranging from 0 to 100, with tick marks at intervals of 10.
* **Left Y-axis:** "Shannon Surprise" - ranging from 0 to 8, with tick marks at intervals of 2.
* **Right Y-axis:** "Bayesian Surprise" - ranging from 0 to 14, with tick marks at intervals of 2.
* **Legend:** Located in the top-right corner.
* "Shannon Surprise" - represented by a dashed blue line.
* "Bayesian Surprise" - represented by a solid red line.
### Detailed Analysis
**Shannon Surprise (Blue Dashed Line):**
The Shannon Surprise line exhibits a highly fluctuating pattern. It starts at approximately 0 at m=0, rises sharply to a peak of around 7.5 at m=18, then drops back down to near 0. It continues to oscillate between approximately 0 and 6.5 for the remainder of the exploration range. The line shows multiple peaks and valleys, indicating significant changes in Shannon Surprise with each exploration.
* m=0: ~0
* m=5: ~2.5
* m=10: ~3.5
* m=15: ~6
* m=18: ~7.5 (Peak)
* m=20: ~1.5
* m=25: ~0.5
* m=30: ~1
* m=35: ~2
* m=40: ~3
* m=45: ~4.5
* m=50: ~1.5
* m=55: ~5
* m=60: ~6.5
* m=65: ~2
* m=70: ~3.5
* m=75: ~4
* m=80: ~1
* m=85: ~2.5
* m=90: ~0.5
* m=95: ~1
* m=100: ~0
**Bayesian Surprise (Red Solid Line):**
The Bayesian Surprise line also fluctuates, but generally remains lower than the Shannon Surprise. It starts at approximately 0 at m=0, rises to a peak of around 13 at m=18, then declines. It oscillates between approximately 0 and 5 for the majority of the exploration range, with a few smaller peaks.
* m=0: ~0
* m=5: ~1.5
* m=10: ~2.5
* m=15: ~4.5
* m=18: ~13 (Peak)
* m=20: ~3
* m=25: ~1
* m=30: ~1.5
* m=35: ~2.5
* m=40: ~3.5
* m=45: ~3
* m=50: ~1.5
* m=55: ~3
* m=60: ~3.5
* m=65: ~1.5
* m=70: ~2
* m=75: ~2.5
* m=80: ~1
* m=85: ~1.5
* m=90: ~0.5
* m=95: ~1
* m=100: ~0.5
### Key Observations
* Both Shannon and Bayesian Surprises exhibit significant fluctuations as the number of explorations increases.
* The Shannon Surprise generally has higher values and more pronounced peaks than the Bayesian Surprise.
* Both metrics reach their highest values around m=18, suggesting a significant change or discovery at that point in the exploration process.
* After m=20, both metrics tend to stabilize, oscillating around lower average values.
### Interpretation
The chart suggests that the initial stages of exploration (up to approximately m=20) are characterized by high uncertainty and significant information gain, as reflected in the high surprise values for both metrics. The peak at m=18 indicates a particularly impactful discovery or change in the system being explored. As the exploration progresses, the surprise values decrease, indicating that the system becomes more predictable and less novel information is revealed.
The difference between Shannon and Bayesian Surprise could be interpreted as a difference in how they quantify uncertainty. Shannon Surprise focuses on the probability of an event, while Bayesian Surprise incorporates prior beliefs. The fact that Shannon Surprise is consistently higher suggests that the system is more unpredictable than initially assumed, or that the prior beliefs used in the Bayesian calculation were relatively accurate.
The fluctuations after m=20 suggest that the exploration process continues to reveal new information, but at a diminishing rate. The overall trend indicates a convergence towards a more stable understanding of the system being explored. The chart provides valuable insights into the dynamics of information gain and uncertainty reduction during an exploration process.