TECHNICAL ASSET FINGERPRINT
7bcede325864c91fc779a595
Click to view fullscreen
Press ESC or click to close
FOUND IN PAPERS
EXPERT: gemini-2.0-flash VERSION 1
RUNTIME: nugit/gemini/gemini-2.0-flash
INTEL_VERIFIED
## Chart: Average Power Rate vs. Number of Variables for Different Densities
### Overview
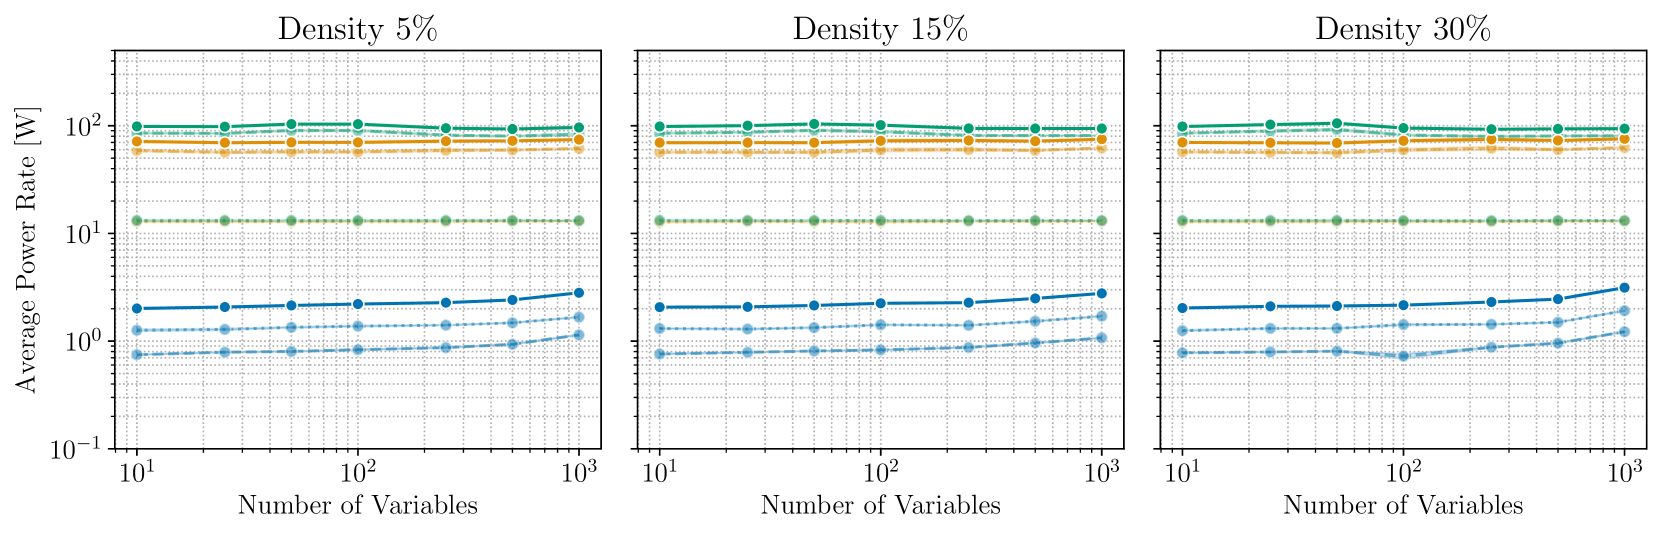
The image presents three line charts comparing the average power rate (in Watts) against the number of variables. Each chart represents a different density level: 5%, 15%, and 30%. The x-axis (Number of Variables) and y-axis (Average Power Rate) are both displayed on a logarithmic scale. Each chart contains five data series, represented by lines of different colors and styles.
### Components/Axes
* **Title:** The title for each chart is "Density X%" where X is 5, 15, or 30.
* **X-axis:**
* Label: "Number of Variables"
* Scale: Logarithmic, ranging from 10^1 (10) to 10^3 (1000).
* Markers: 10^1, 10^2, 10^3
* **Y-axis:**
* Label: "Average Power Rate [W]"
* Scale: Logarithmic, ranging from 10^-1 (0.1) to 10^2 (100).
* Markers: 10^-1, 10^0, 10^1, 10^2
* **Data Series:** There are five data series in each chart, distinguished by color and line style. However, there is no explicit legend provided. Based on visual analysis, the lines are (from top to bottom):
1. Green (solid line): Highest power rate, relatively constant.
2. Orange (dashed line): Second highest power rate, relatively constant.
3. Light Green (dotted line): Third highest power rate, constant.
4. Blue (solid line): Fourth highest power rate, slightly increasing.
5. Light Blue (dashed line): Lowest power rate, slightly increasing.
### Detailed Analysis
**Density 5%**
* **Green (solid line):** The average power rate is approximately constant at 100 W across the range of variables.
* At 10 variables, the power rate is approximately 95 W.
* At 1000 variables, the power rate is approximately 95 W.
* **Orange (dashed line):** The average power rate is approximately constant at 63 W across the range of variables.
* At 10 variables, the power rate is approximately 63 W.
* At 1000 variables, the power rate is approximately 63 W.
* **Light Green (dotted line):** The average power rate is approximately constant at 12 W across the range of variables.
* At 10 variables, the power rate is approximately 12 W.
* At 1000 variables, the power rate is approximately 12 W.
* **Blue (solid line):** The average power rate increases slightly from approximately 1.2 W to 2.5 W as the number of variables increases.
* At 10 variables, the power rate is approximately 1.2 W.
* At 1000 variables, the power rate is approximately 2.5 W.
* **Light Blue (dashed line):** The average power rate increases slightly from approximately 0.4 W to 1.2 W as the number of variables increases.
* At 10 variables, the power rate is approximately 0.4 W.
* At 1000 variables, the power rate is approximately 1.2 W.
**Density 15%**
* **Green (solid line):** The average power rate is approximately constant at 100 W across the range of variables.
* At 10 variables, the power rate is approximately 95 W.
* At 1000 variables, the power rate is approximately 95 W.
* **Orange (dashed line):** The average power rate is approximately constant at 63 W across the range of variables.
* At 10 variables, the power rate is approximately 63 W.
* At 1000 variables, the power rate is approximately 63 W.
* **Light Green (dotted line):** The average power rate is approximately constant at 12 W across the range of variables.
* At 10 variables, the power rate is approximately 12 W.
* At 1000 variables, the power rate is approximately 12 W.
* **Blue (solid line):** The average power rate increases slightly from approximately 1.2 W to 3.2 W as the number of variables increases.
* At 10 variables, the power rate is approximately 1.2 W.
* At 1000 variables, the power rate is approximately 3.2 W.
* **Light Blue (dashed line):** The average power rate increases slightly from approximately 0.4 W to 1.6 W as the number of variables increases.
* At 10 variables, the power rate is approximately 0.4 W.
* At 1000 variables, the power rate is approximately 1.6 W.
**Density 30%**
* **Green (solid line):** The average power rate is approximately constant at 100 W across the range of variables.
* At 10 variables, the power rate is approximately 95 W.
* At 1000 variables, the power rate is approximately 95 W.
* **Orange (dashed line):** The average power rate is approximately constant at 63 W across the range of variables.
* At 10 variables, the power rate is approximately 63 W.
* At 1000 variables, the power rate is approximately 63 W.
* **Light Green (dotted line):** The average power rate is approximately constant at 12 W across the range of variables.
* At 10 variables, the power rate is approximately 12 W.
* At 1000 variables, the power rate is approximately 12 W.
* **Blue (solid line):** The average power rate increases slightly from approximately 1.2 W to 4 W as the number of variables increases.
* At 10 variables, the power rate is approximately 1.2 W.
* At 1000 variables, the power rate is approximately 4 W.
* **Light Blue (dashed line):** The average power rate increases slightly from approximately 0.4 W to 2 W as the number of variables increases.
* At 10 variables, the power rate is approximately 0.4 W.
* At 1000 variables, the power rate is approximately 2 W.
### Key Observations
* The green, orange, and light green lines remain relatively constant across all densities and number of variables.
* The blue and light blue lines show a slight increase in average power rate as the number of variables increases.
* The average power rate for the blue and light blue lines increases more significantly with the number of variables as the density increases from 5% to 30%.
### Interpretation
The charts suggest that for the top three data series (green, orange, and light green), the average power rate is largely independent of the number of variables and the density. However, for the bottom two data series (blue and light blue), the average power rate increases slightly with the number of variables, and this increase is more pronounced at higher densities. This could indicate that the processes represented by the blue and light blue lines are more sensitive to the number of variables and density compared to the processes represented by the other lines. The lack of a legend makes it difficult to definitively interpret what these data series represent, but the trends suggest different sensitivities to the parameters being varied.
DECODING INTELLIGENCE...