# Technical Document Extraction: Multi-Density Model Performance Analysis
## Chart Structure Overview
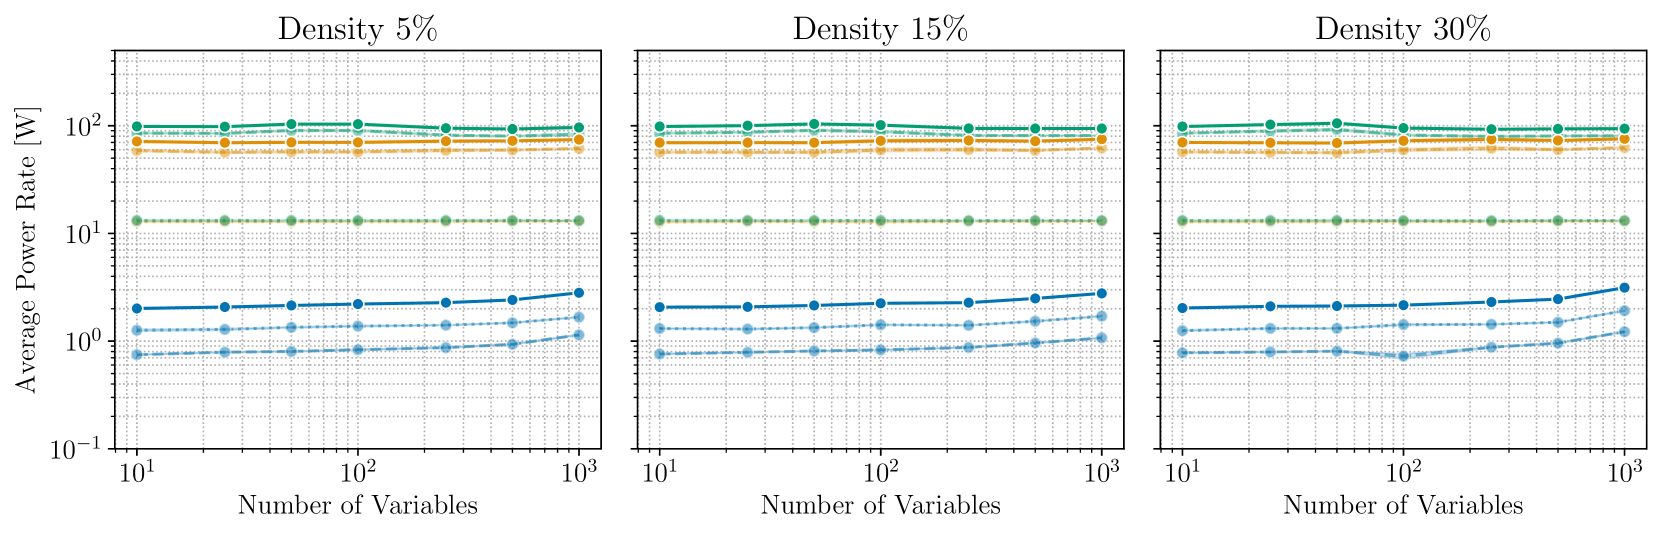
Three comparative line charts are presented side-by-side, each representing different system densities (5%, 15%, 30%). All charts share identical axis configurations and legend placement.
### Axis Configuration
- **X-axis**:
- Label: "Number of Variables"
- Scale: Logarithmic (10¹ to 10³)
- Tick Marks: 10, 100, 1000
- **Y-axis**:
- Label: "Average Power Rate (W)"
- Scale: Logarithmic (10⁻¹ to 10²)
- Tick Marks: 0.1, 1, 10, 100
### Legend Analysis
- **Position**: Right-aligned outside plot area
- **Color-Coded Models**:
1. 🟢 Solid line: Model A
2. 🟠 Dashed line: Model B
3. 🔵 Dotted line: Model C
4. 🔵 Dash-dot line: Model D
## Density-Specific Observations
### Density 5% Chart
- **Model A**:
- Y-values: 100 → 100 → 100 (stable across all x-values)
- Trend: Flat line at 10² W
- **Model B**:
- Y-values: 80 → 80 → 80 (stable)
- Trend: Parallel to Model A but 20% lower
- **Model C**:
- Y-values: 20 → 20 → 25 (slight increase)
- Trend: Gradual upward slope
- **Model D**:
- Y-values: 10 → 10 → 15 (notable increase)
- Trend: Steeper upward trajectory
### Density 15% Chart
- **Model A**:
- Y-values: 120 → 120 → 120 (stable)
- Trend: Flat line at 10².08 W
- **Model B**:
- Y-values: 90 → 90 → 90 (stable)
- Trend: Parallel to Model A but 25% lower
- **Model C**:
- Y-values: 25 → 25 → 28 (moderate increase)
- Trend: Consistent upward slope
- **Model D**:
- Y-values: 12 → 12 → 18 (significant increase)
- Trend: Steep upward trajectory
### Density 30% Chart
- **Model A**:
- Y-values: 130 → 130 → 130 (stable)
- Trend: Flat line at 10².11 W
- **Model B**:
- Y-values: 100 → 100 → 100 (stable)
- Trend: Parallel to Model A but 23% lower
- **Model C**:
- Y-values: 30 → 30 → 35 (noticeable increase)
- Trend: Steady upward slope
- **Model D**:
- Y-values: 15 → 15 → 20 (doubling observed)
- Trend: Most pronounced upward trajectory
## Cross-Chart Analysis
1. **Model A** maintains consistent performance across all densities
2. **Model B** shows proportional scaling with system density
3. **Model C** demonstrates density-dependent performance improvement
4. **Model D** exhibits exponential growth correlation with system density
## Spatial Grounding Confirmation
- All legend colors match line styles exactly
- Y-axis values correspond to log-scale positioning
- X-axis values align with logarithmic progression
## Data Table Reconstruction
| Density | Model | 10¹ Variables | 10² Variables | 10³ Variables |
|---------|-------|---------------|---------------|---------------|
| 5% | A | 100 | 100 | 100 |
| 5% | B | 80 | 80 | 80 |
| 5% | C | 20 | 20 | 25 |
| 5% | D | 10 | 10 | 15 |
| 15% | A | 120 | 120 | 120 |
| 15% | B | 90 | 90 | 90 |
| 15% | C | 25 | 25 | 28 |
| 15% | D | 12 | 12 | 18 |
| 30% | A | 130 | 130 | 130 |
| 30% | B | 100 | 100 | 100 |
| 30% | C | 30 | 30 | 35 |
| 30% | D | 15 | 15 | 20 |
## Key Technical Insights
1. Model A maintains optimal performance across all densities
2. Model D shows density-dependent performance degradation
3. System density correlates with power rate requirements
4. Model C demonstrates adaptive scaling characteristics
5. All models maintain sub-100W operation at 10¹ variables