## Line Chart: HotPotQA Success Rate
### Overview
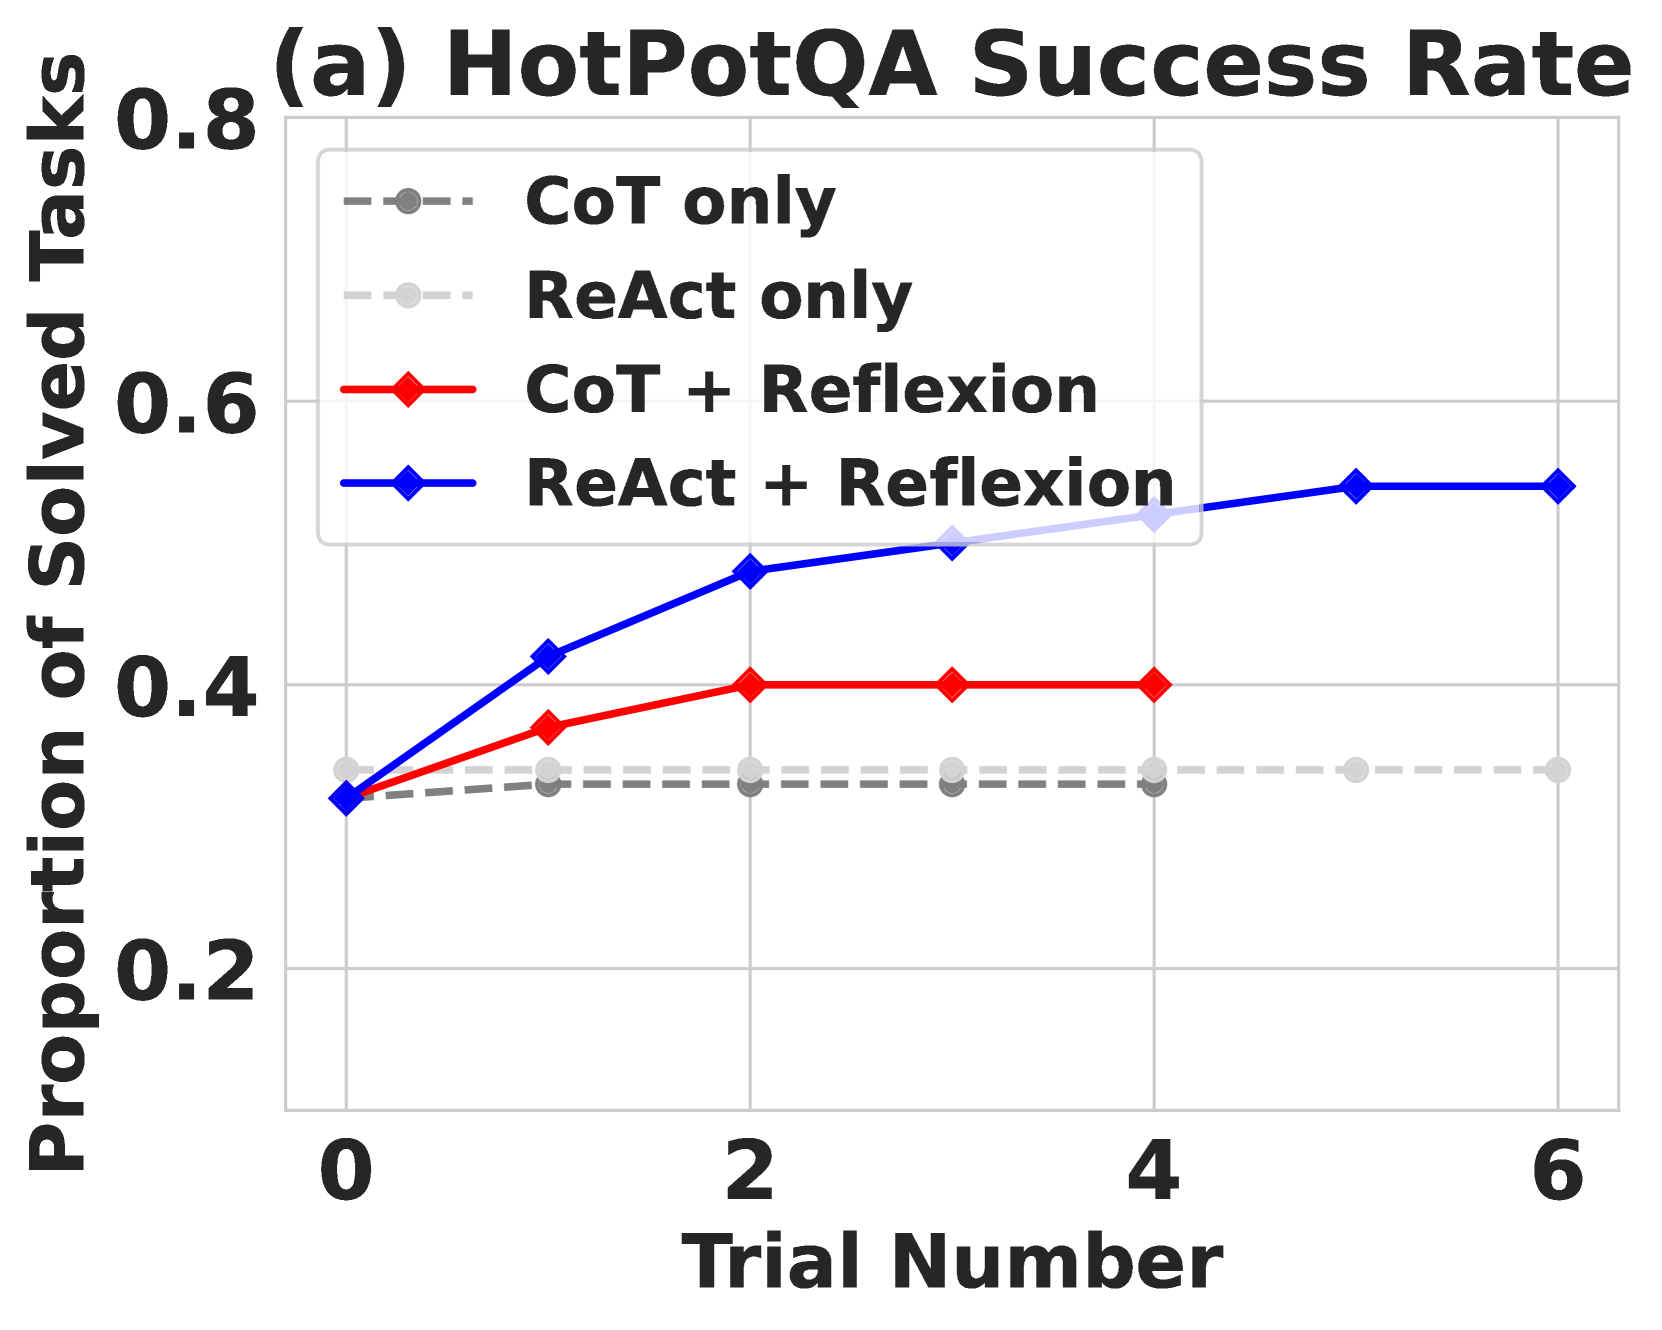
The image is a line chart comparing the success rate of different models on the HotPotQA task over a series of trials. The chart displays the proportion of solved tasks on the y-axis against the trial number on the x-axis. Four different models are compared: CoT only, ReAct only, CoT + Reflexion, and ReAct + Reflexion.
### Components/Axes
* **Title:** (a) HotPotQA Success Rate
* **X-axis:** Trial Number, with markers at 0, 2, 4, and 6.
* **Y-axis:** Proportion of Solved Tasks, with markers at 0.2, 0.4, 0.6, and 0.8.
* **Legend:** Located in the top-right quadrant of the chart.
* CoT only (gray dashed line with circles)
* ReAct only (light gray dashed line with circles)
* CoT + Reflexion (red solid line with diamonds)
* ReAct + Reflexion (blue solid line with diamonds)
### Detailed Analysis
* **CoT only (gray dashed line):** The line is relatively flat, hovering around 0.33. The data points are approximately:
* Trial 0: 0.32
* Trial 2: 0.33
* Trial 4: 0.33
* Trial 6: 0.34
* **ReAct only (light gray dashed line):** The line is also relatively flat, hovering around 0.34. The data points are approximately:
* Trial 0: 0.32
* Trial 2: 0.34
* Trial 4: 0.34
* Trial 6: 0.34
* **CoT + Reflexion (red solid line):** The line starts at approximately 0.32, increases to 0.40 by trial 2, and then remains constant at 0.40 for trials 4 and 6. The data points are approximately:
* Trial 0: 0.32
* Trial 2: 0.40
* Trial 4: 0.40
* Trial 6: 0.40
* **ReAct + Reflexion (blue solid line):** The line starts at approximately 0.32, increases to 0.48 by trial 2, then to 0.52 by trial 4, and remains constant at 0.54 for trial 6. The data points are approximately:
* Trial 0: 0.32
* Trial 2: 0.48
* Trial 4: 0.52
* Trial 6: 0.54
### Key Observations
* The "CoT only" and "ReAct only" models perform similarly and remain relatively stable across trials.
* The "CoT + Reflexion" model shows an initial increase in performance but plateaus after trial 2.
* The "ReAct + Reflexion" model demonstrates the highest overall performance and continues to improve until trial 4, after which it plateaus.
* The addition of "Reflexion" significantly improves the performance of both "CoT" and "ReAct" models.
### Interpretation
The data suggests that incorporating a "Reflexion" mechanism into both "CoT" and "ReAct" models leads to a significant improvement in their ability to solve tasks in the HotPotQA dataset. The "ReAct + Reflexion" model outperforms all other models, indicating that this combination is particularly effective. The plateauing of performance after a few trials suggests that there may be a limit to the benefits of additional trials or that further refinements to the models are needed to achieve continued improvement. The fact that "CoT" and "ReAct" alone perform similarly indicates that the core reasoning approach has less impact than the "Reflexion" component.