## [Line Graph]: (a) HotPotQA Success Rate
### Overview
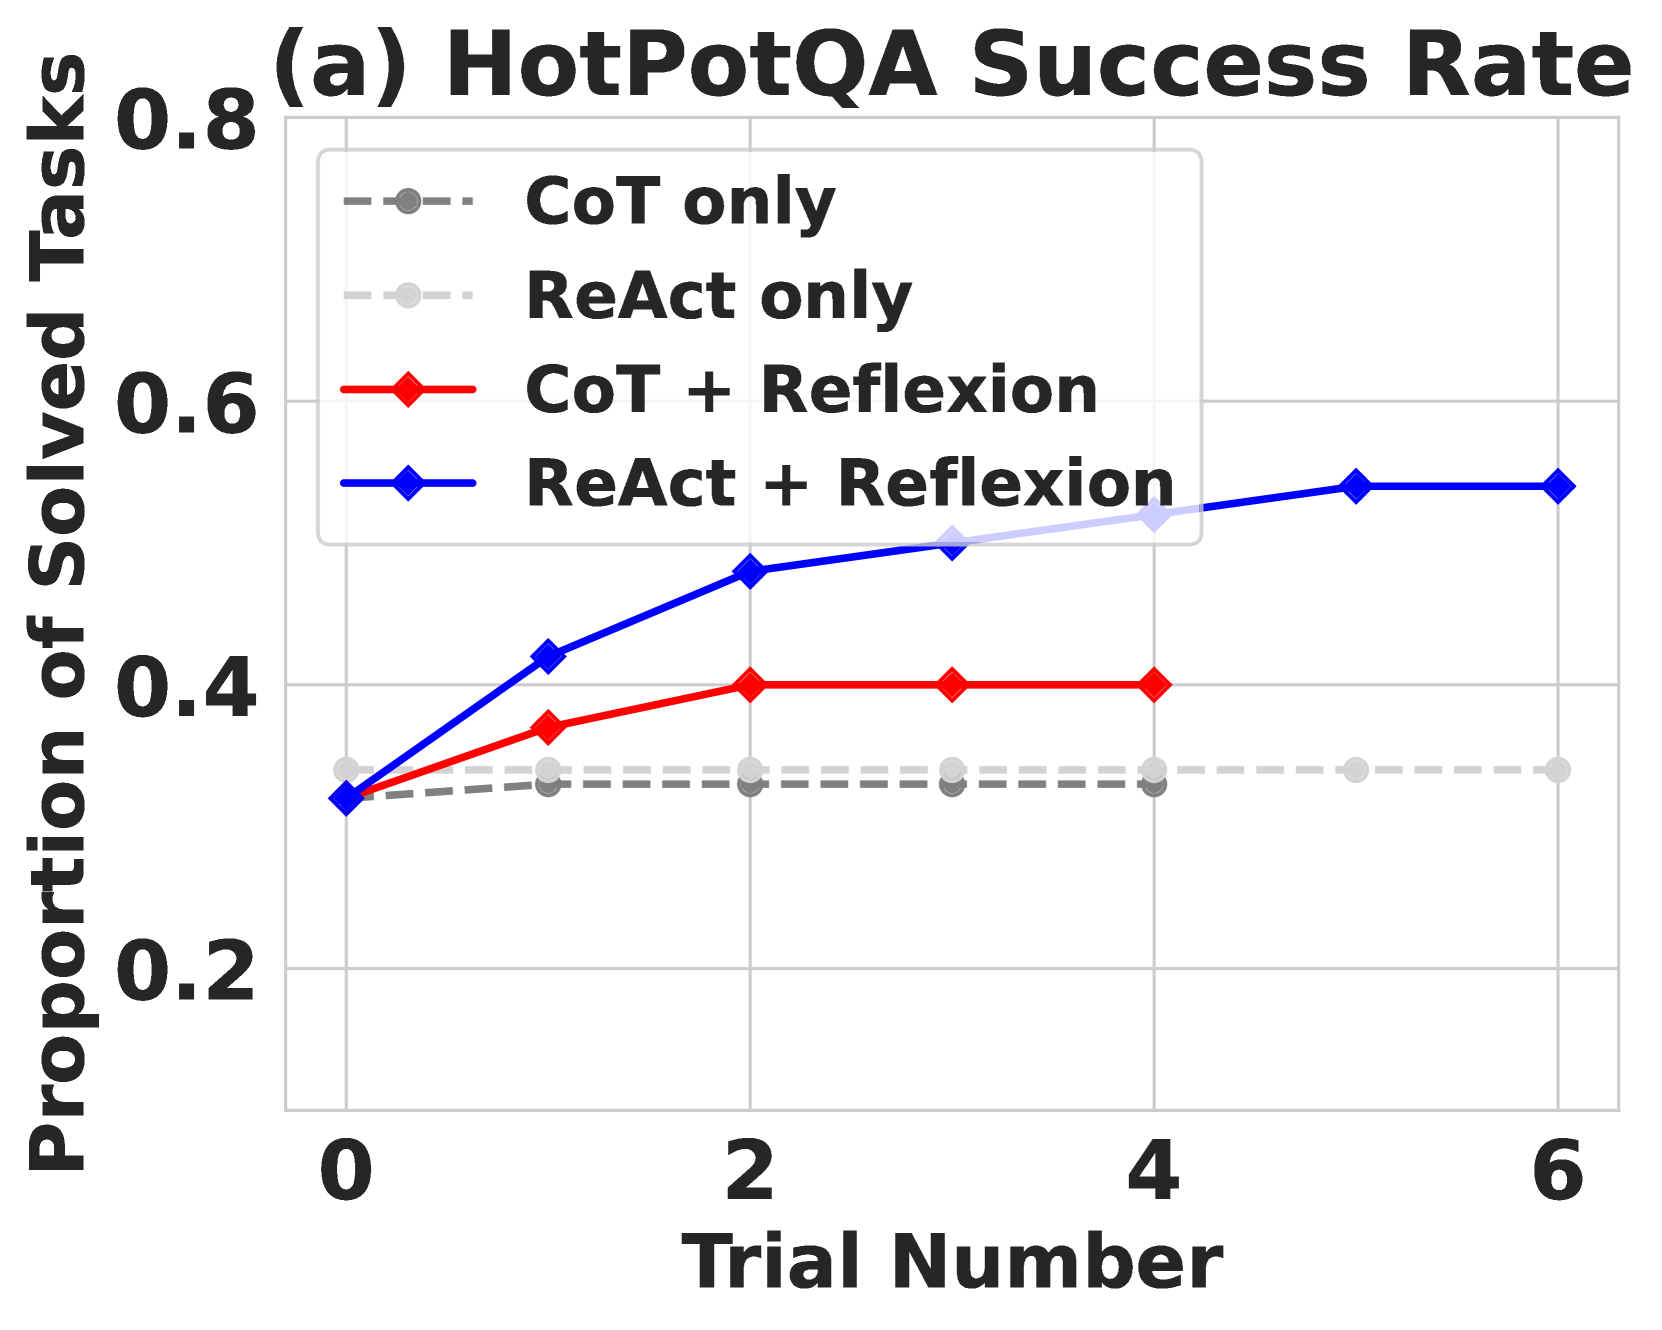
The image is a line graph titled “(a) HotPotQA Success Rate,” illustrating the **proportion of solved tasks** (y - axis) across **trial numbers** (x - axis) for four methods: *CoT only*, *ReAct only*, *CoT + Reflexion*, and *ReAct + Reflexion*.
### Components/Axes
- **Title**: “(a) HotPotQA Success Rate”
- **Y - axis**: Labeled “Proportion of Solved Tasks,” with a scale from 0.2 to 0.8 (increments of 0.2: 0.2, 0.4, 0.6, 0.8).
- **X - axis**: Labeled “Trial Number,” with ticks at 0, 2, 4, 6 (data points are plotted at trials 0–6).
- **Legend** (top - left, within the plot area):
- *CoT only*: Gray dashed line with circle markers.
- *ReAct only*: Light gray dashed line with circle markers.
- *CoT + Reflexion*: Red solid line with diamond markers.
- *ReAct + Reflexion*: Blue solid line with diamond markers.
### Detailed Analysis (Data Points & Trends)
We analyze each method’s performance across trials (0–6):
1. **CoT only (gray dashed, circles)**:
- Trend: Flat (no improvement over trials).
- Data points (approximate): Trial 0: ~0.32; Trial 1: ~0.32; Trial 2: ~0.32; Trial 3: ~0.32; Trial 4: ~0.32; Trial 5: ~0.32; Trial 6: ~0.32.
2. **ReAct only (light gray dashed, circles)**:
- Trend: Flat (no improvement over trials).
- Data points (approximate): Trial 0: ~0.32; Trial 1: ~0.32; Trial 2: ~0.32; Trial 3: ~0.32; Trial 4: ~0.32; Trial 5: ~0.32; Trial 6: ~0.32.
3. **CoT + Reflexion (red solid, diamonds)**:
- Trend: Increases from Trial 0 to 2, then plateaus.
- Data points (approximate): Trial 0: ~0.32; Trial 1: ~0.37; Trial 2: ~0.40; Trial 3: ~0.40; Trial 4: ~0.40; Trial 5: ~0.40; Trial 6: ~0.40.
4. **ReAct + Reflexion (blue solid, diamonds)**:
- Trend: Steady increase from Trial 0 to 6 (slight plateau at Trials 5–6).
- Data points (approximate): Trial 0: ~0.32; Trial 1: ~0.42; Trial 2: ~0.48; Trial 3: ~0.50; Trial 4: ~0.52; Trial 5: ~0.54; Trial 6: ~0.54.
### Key Observations
- **Baseline Methods (CoT only, ReAct only)**: Both have a flat success rate (~0.32) across all trials, showing no improvement with more attempts.
- **Reflexion - Enhanced Methods**: Both *CoT + Reflexion* and *ReAct + Reflexion* improve over trials, with *ReAct + Reflexion* outperforming *CoT + Reflexion*.
- **Initial Performance (Trial 0)**: All methods start at the same success rate (~0.32), indicating identical initial performance.
### Interpretation
The graph demonstrates that **adding Reflexion (a reflection - based method) to CoT or ReAct improves HotPotQA task success over trials**. *ReAct + Reflexion* shows the most significant improvement, suggesting that combining ReAct’s reasoning - action framework with Reflexion’s iterative reflection is highly effective. Baseline methods (without Reflexion) do not improve with more trials, highlighting Reflexion’s role in enabling learning from repeated attempts. This implies that iterative reflection helps the model refine its approach, especially when paired with ReAct’s structured reasoning - action process.